Fig. 1.
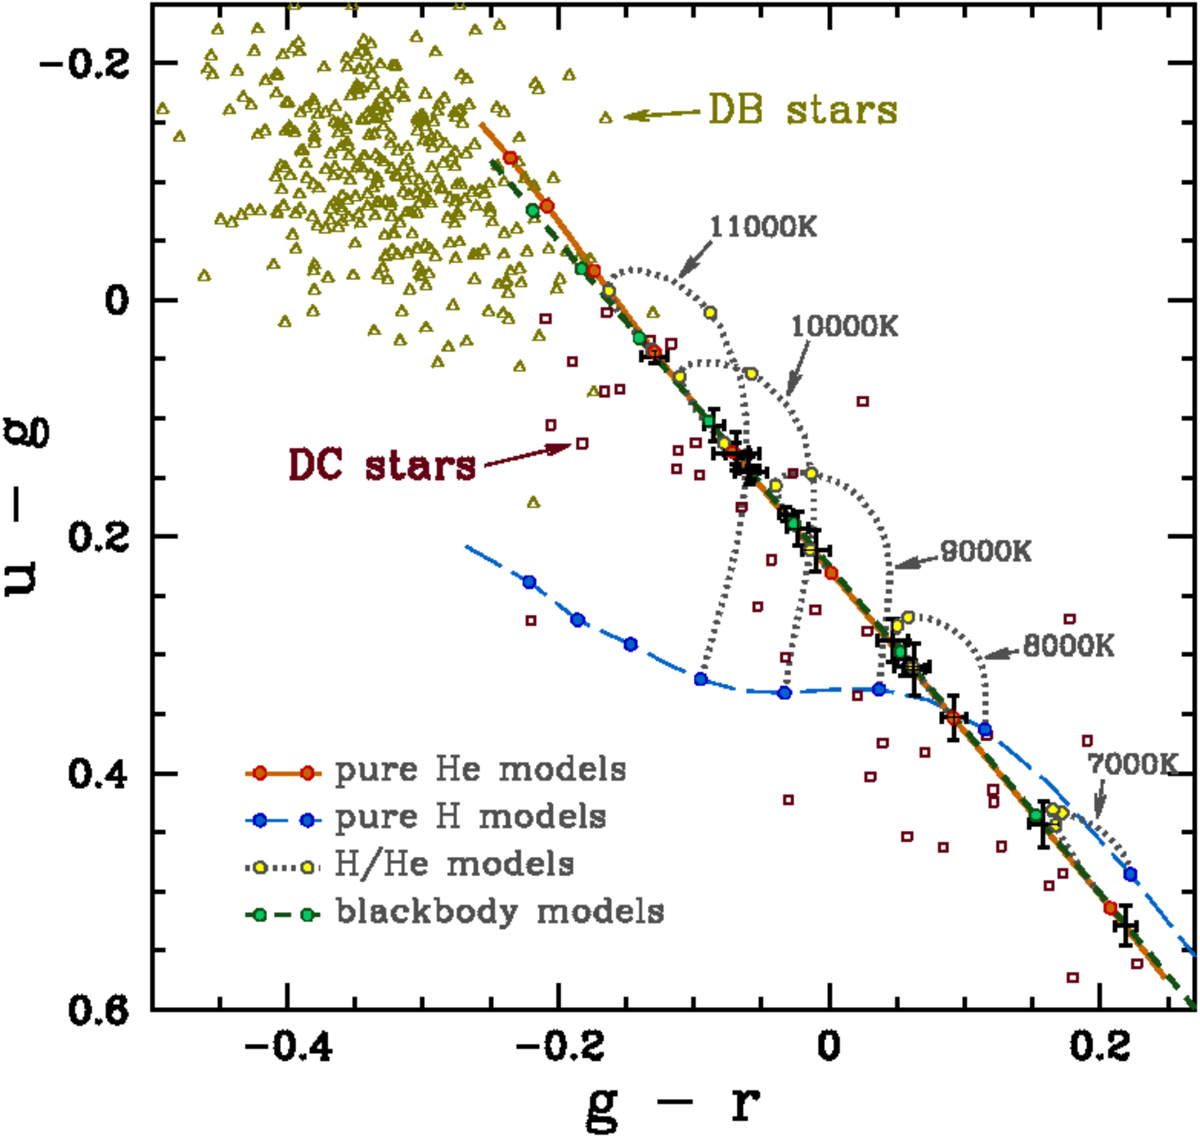
Color–color diagram for a sample of WD stars from the SDSS DR7 catalog (Kleinman et al. 2013). The SF18 sample is shown with error bars. Lines denote theoretical color-color curves for blackbody (green short-dashed), pure-He (red solid), pure-H (blue long-dashed), and mixed H/He (dotted) atmosphere models as indicated in the figure legend, in the range 14 000–7000 K. Small circles on top of the curves show blackbody, He atmosphere, and H atmosphere models with marks indicating 1000 K intervals. The circles on the bridging between H and He models mark the log(NH/NHe) = −2, −4, −6 values.
Current usage metrics show cumulative count of Article Views (full-text article views including HTML views, PDF and ePub downloads, according to the available data) and Abstracts Views on Vision4Press platform.
Data correspond to usage on the plateform after 2015. The current usage metrics is available 48-96 hours after online publication and is updated daily on week days.
Initial download of the metrics may take a while.