Fig. 6.
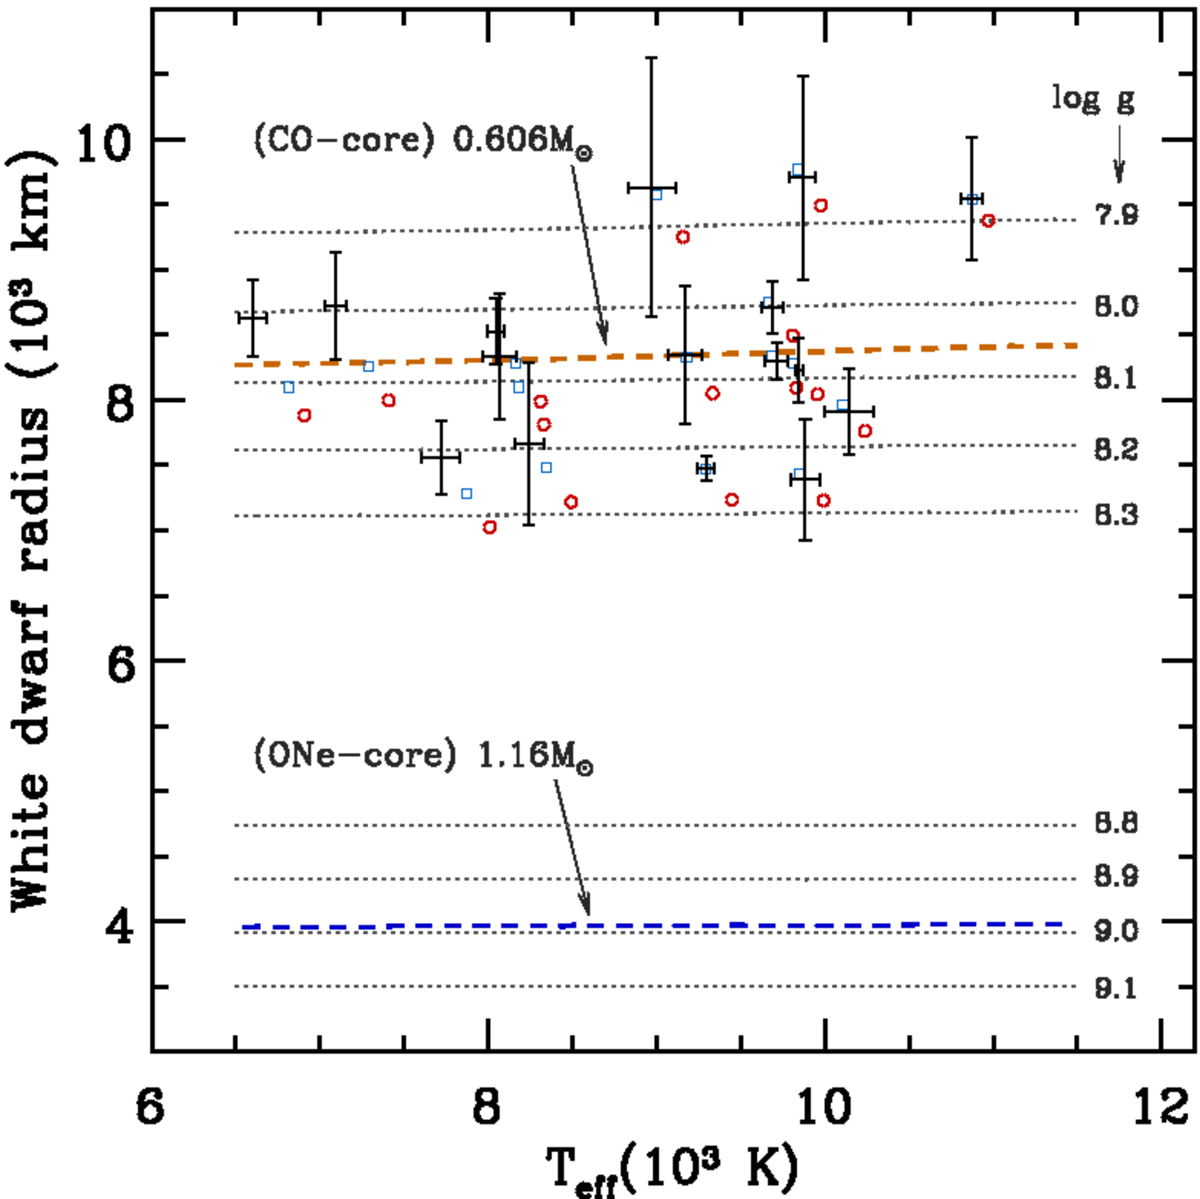
Teff and radius of stars in the SF18 sample with measured Gaia parallaxes. Results for different sets of model atmospheres are shown as red circles (logg = 8, He-pure models), blue squares (logg = 9, pure-He models), and black dots with error bars (logg = 8, log(NH/NHe) = −6). Overlaid with long dashed lines are theoretical WD evolutionary tracks for 0.606 M⊙ (CO-core) and 1.16 M⊙ (ONe-core) WD models. Short dashed lines show curves of constant logg determined from evolutionary models.
Current usage metrics show cumulative count of Article Views (full-text article views including HTML views, PDF and ePub downloads, according to the available data) and Abstracts Views on Vision4Press platform.
Data correspond to usage on the plateform after 2015. The current usage metrics is available 48-96 hours after online publication and is updated daily on week days.
Initial download of the metrics may take a while.