Free Access
Fig. 2.
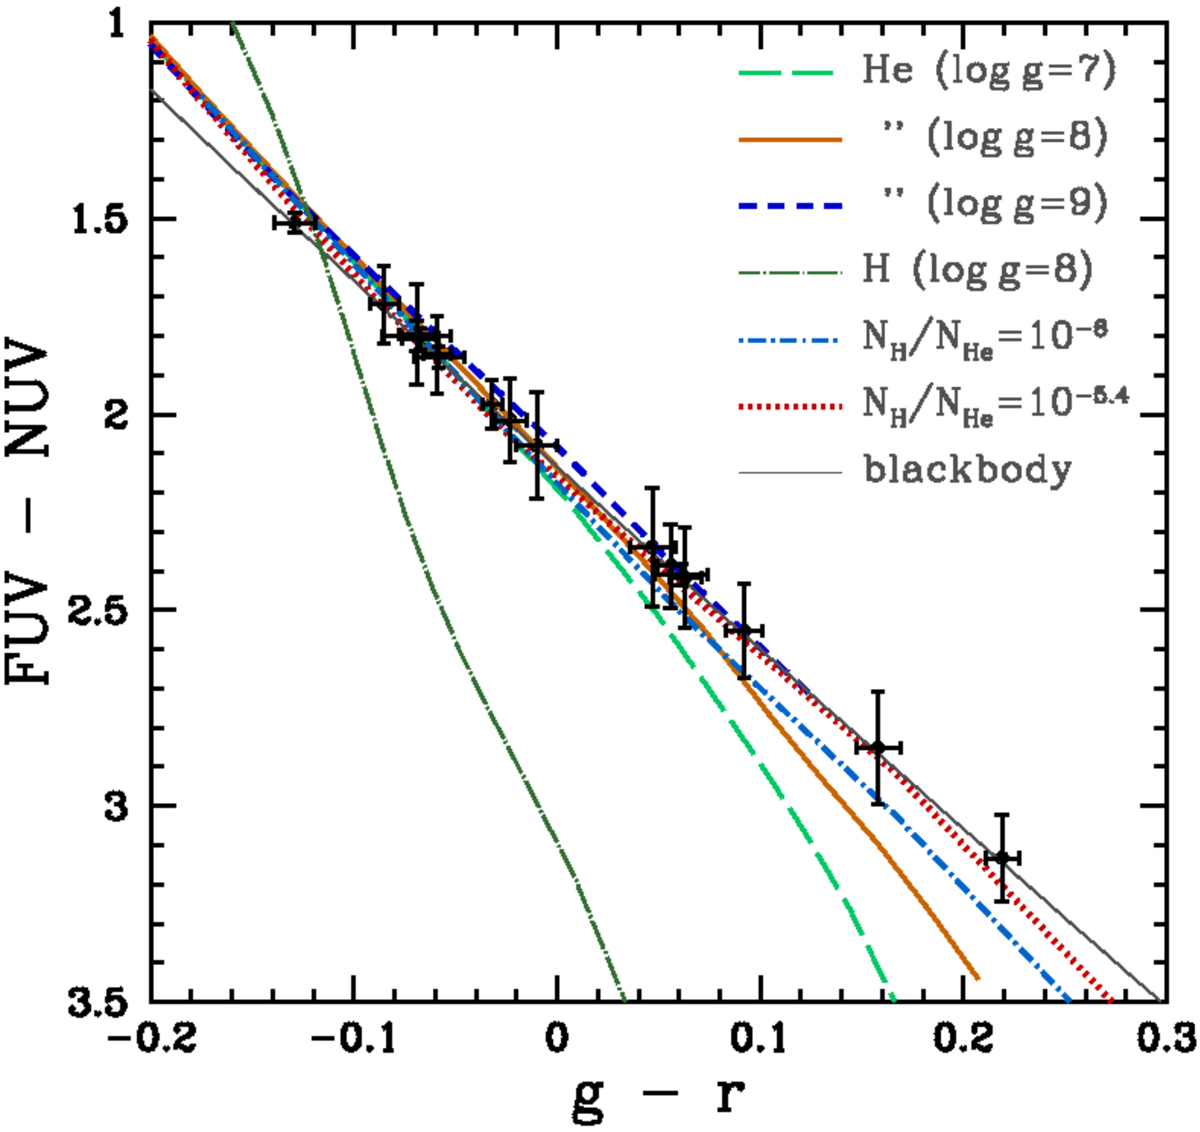
(FUV − NUV)−(g − r) color–color diagram. Stars in the SF18 sample are shown as black dots with error bars. Lines denote theoretical models as indicated in the legend. Models with H/He mixtures correspond to logg = 8. The H/He models with log(NH/NHe) = −5.4 reproduce all data of stars in the SF18 sample.
Current usage metrics show cumulative count of Article Views (full-text article views including HTML views, PDF and ePub downloads, according to the available data) and Abstracts Views on Vision4Press platform.
Data correspond to usage on the plateform after 2015. The current usage metrics is available 48-96 hours after online publication and is updated daily on week days.
Initial download of the metrics may take a while.