Fig. 7
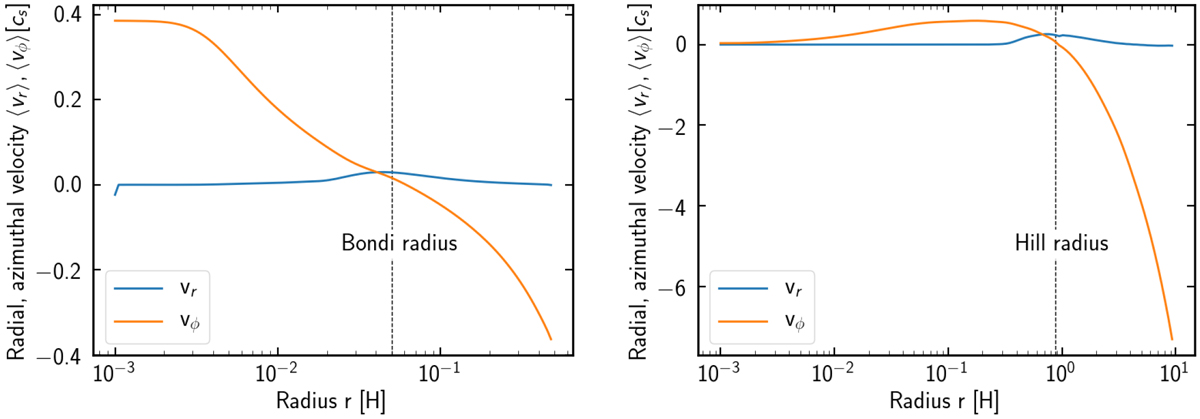
Azimuthally averaged radial and azimuthal velocity as a function of the radius r. Left panel: result from m005 run at t = 30. Right panel: result from m2 run at t = 100. The solid lines correspond to the radial (blue) and azimuthal (orange) velocity of the gas flow in the vicinity of the planet. The dashed line shows the position of the Bondi or Hill radius of the planet.
Current usage metrics show cumulative count of Article Views (full-text article views including HTML views, PDF and ePub downloads, according to the available data) and Abstracts Views on Vision4Press platform.
Data correspond to usage on the plateform after 2015. The current usage metrics is available 48-96 hours after online publication and is updated daily on week days.
Initial download of the metrics may take a while.