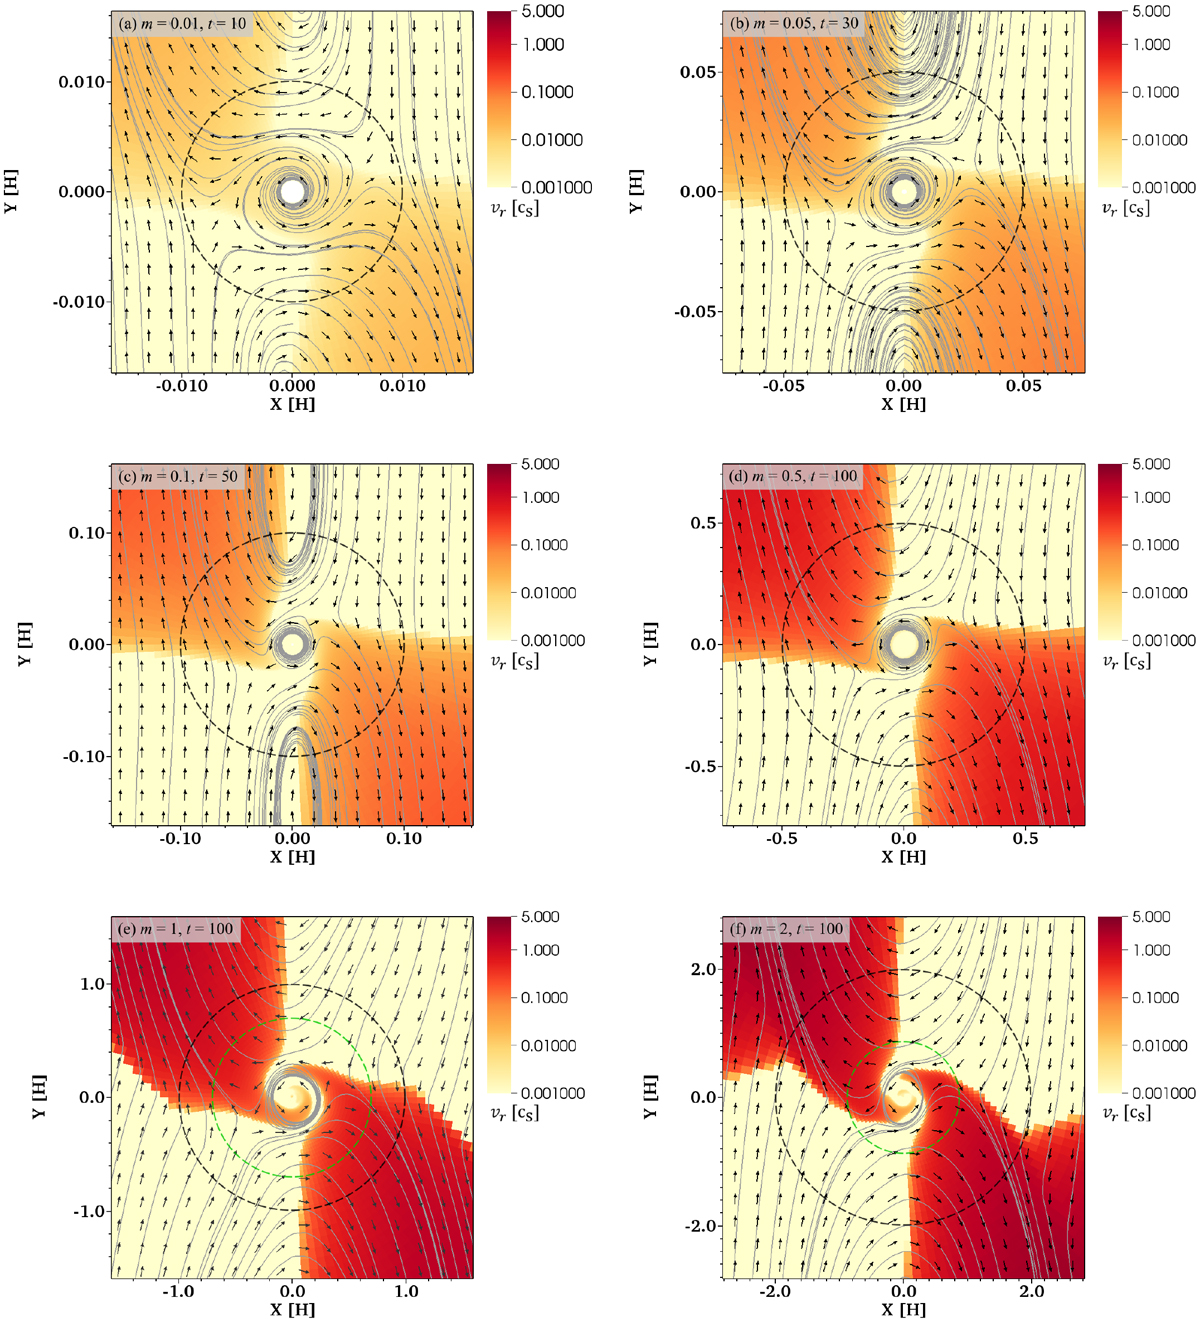
Fig. 6
Changes of the outflow speed at the midplane of the disc according to the planetary mass. Each panel corresponds to each result obtained from different simulations at t = tend. Colour contour represents the flow speed in the radial direction. In order to show the differences of the outflow speed specifically, we plotted in a logarithmic scale. We note that the colour contour is saturated for the inflow (vr < 0) region. The orange-red and yellow areas mostly correspond to the regions where the radial velocity is positive or negative, respectively (see Fig. 2). The solid lines correspond to the specific streamlines of the gas flow. The black dashed line corresponds to the Bondi radius of the planet. The green dashed line shown in panels e and f corresponds to the Hill radius. We note that the length of the arrows does not scale with the flow speed.
Current usage metrics show cumulative count of Article Views (full-text article views including HTML views, PDF and ePub downloads, according to the available data) and Abstracts Views on Vision4Press platform.
Data correspond to usage on the plateform after 2015. The current usage metrics is available 48-96 hours after online publication and is updated daily on week days.
Initial download of the metrics may take a while.