Fig. 4
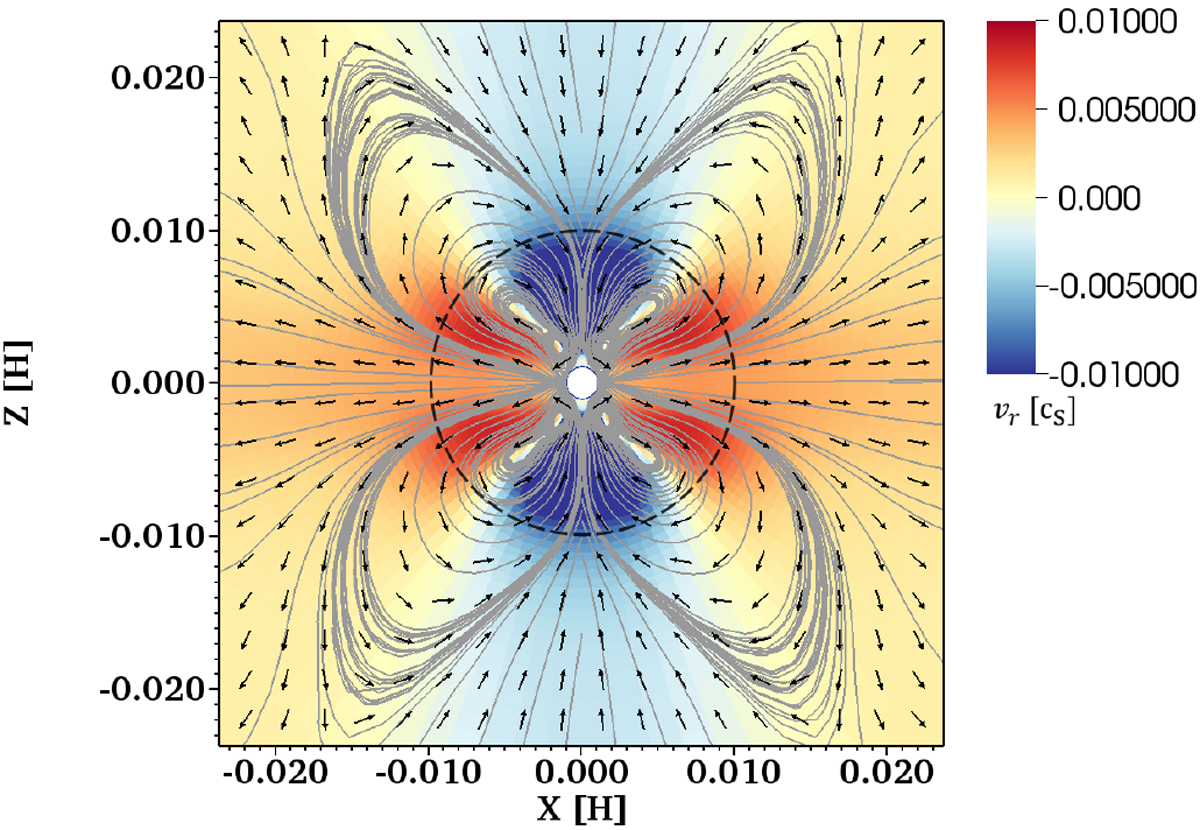
Vertical structure of inflow and outflow at the meridian plane (y = 0) obtained from m001 at t = 10. The red andblue regions correspond to areas where gas flows outwards and inwards in the radial direction, respectively. The solid and dashed lines represent the specific streamlines of gas flow and the Bondi radius of the planet, respectively. The contourhas the same meaning as that in Fig. 2, but the ranges are different. Since we adjusted the range of thecontour to show the vertical structure of the outflow, the value of inflow is saturated in the vicinity of the planet. We note that the length of the arrows does not scale with the flow speed.
Current usage metrics show cumulative count of Article Views (full-text article views including HTML views, PDF and ePub downloads, according to the available data) and Abstracts Views on Vision4Press platform.
Data correspond to usage on the plateform after 2015. The current usage metrics is available 48-96 hours after online publication and is updated daily on week days.
Initial download of the metrics may take a while.