Fig. 3
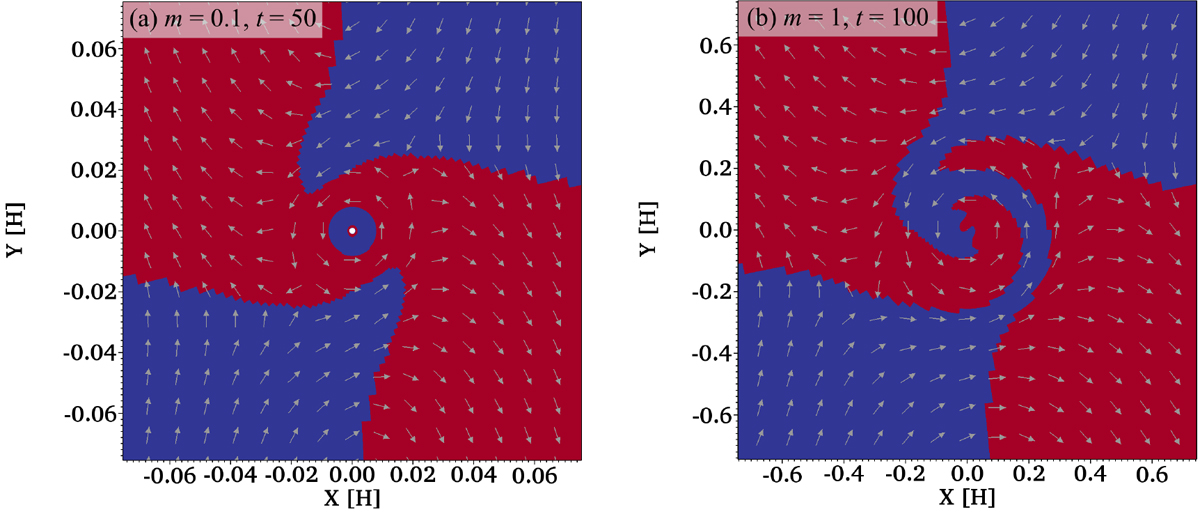
Structure of the inflow and outflow in the region close to the planet at the midplane. Panel a: result obtained from m01 at t = 50. Panel b: result obtained from m1 at t = 100. In order to distinguish the inflow and outflow clearly, we plotted vr∕|vr|. Red and blue correspond to the regions where vr∕|vr| has positive and negative values. We note that the length of the arrows does not scale with the flow speed.
Current usage metrics show cumulative count of Article Views (full-text article views including HTML views, PDF and ePub downloads, according to the available data) and Abstracts Views on Vision4Press platform.
Data correspond to usage on the plateform after 2015. The current usage metrics is available 48-96 hours after online publication and is updated daily on week days.
Initial download of the metrics may take a while.