Fig. 2
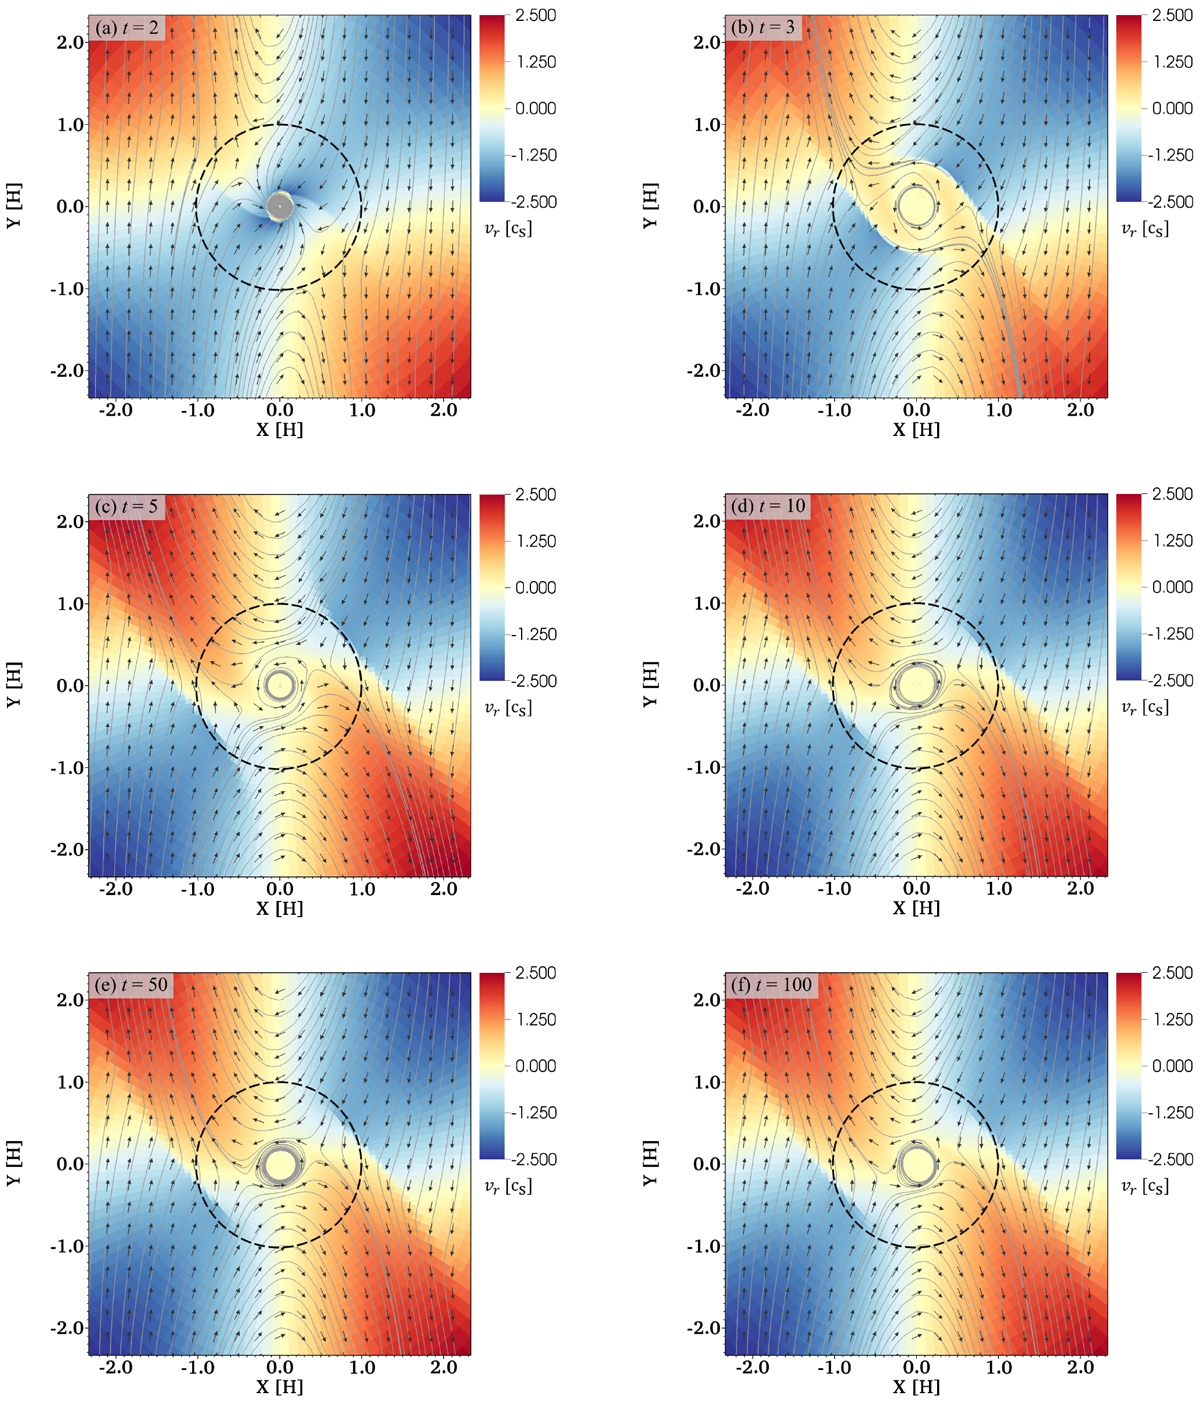
Time evolution of the flow field around a planet with m = 1.0 at the midplane of the disc. Each panel corresponds to the snapshots at t = 2, 3, 5, 10, 50, and 100. Since we set the injection time to unity, in this run, the gravity of the planet has been completely inserted into the disc in all panels. Colour contour represents the flow speed in the radial direction. The vertical and horizontal axes are normalised by the scaleheight of the disc. The solid and dashed lines correspond to the specific streamlines and the Bondi radius of the planet, respectively. Blue and red regions imply where the gas flows inwards and outwards. After accretion phase (t < 2), gas flowing from the centre of the planet (outflow) emerges in the early stage of the time evolution. The topologies of the flow field have not significantly changed after t = 5 in this simulation. We note that the length of the arrows does not scale with the flow speed.
Current usage metrics show cumulative count of Article Views (full-text article views including HTML views, PDF and ePub downloads, according to the available data) and Abstracts Views on Vision4Press platform.
Data correspond to usage on the plateform after 2015. The current usage metrics is available 48-96 hours after online publication and is updated daily on week days.
Initial download of the metrics may take a while.