Fig. B.2
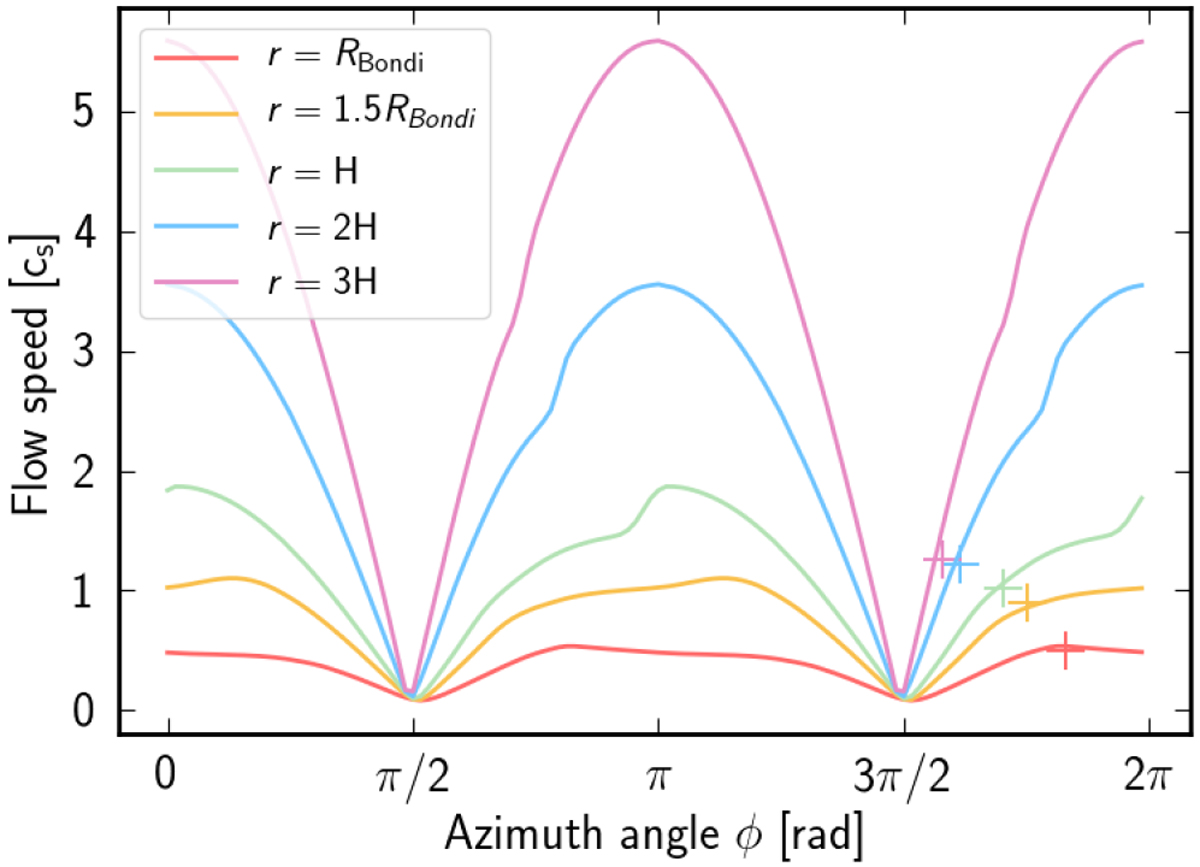
Flow speed obtained by m05 run as a function of azimuth angle at different r and t =tend. The cross symbols coloured by red, orange, green, blue, and purple correspond to the flow speed estimated by Eq. (16), ![]() , at the intersections of the circles coloured by red, orange, green, blue, and purple with the atmospheric recycling streamline in the forth quadrant plotted in Fig. B.1.
, at the intersections of the circles coloured by red, orange, green, blue, and purple with the atmospheric recycling streamline in the forth quadrant plotted in Fig. B.1.
Current usage metrics show cumulative count of Article Views (full-text article views including HTML views, PDF and ePub downloads, according to the available data) and Abstracts Views on Vision4Press platform.
Data correspond to usage on the plateform after 2015. The current usage metrics is available 48-96 hours after online publication and is updated daily on week days.
Initial download of the metrics may take a while.