Fig. B.1
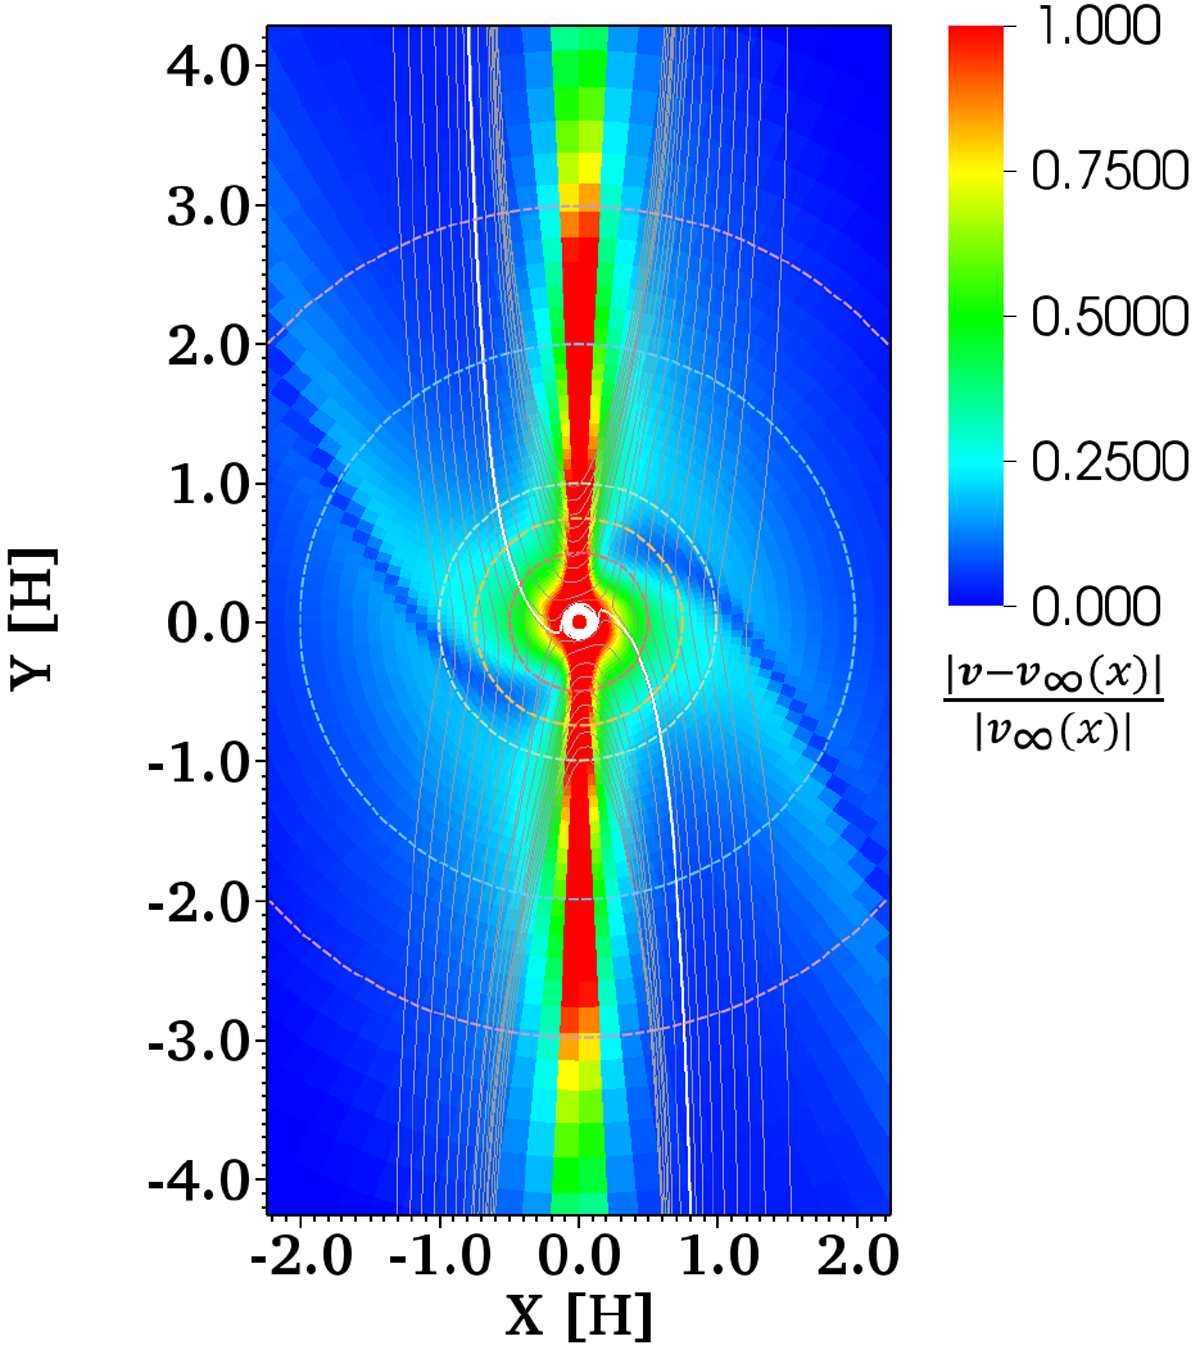
The colour contour shows the difference of flow speed from the Keplerian shear obtained by m05 run at t = tend. We plotted |v − v∞(x)|∕|v∞(x)|, where v is the gas velocity and v∞(x) is the Keplerian shear expressed by Eq. (10). The contour shows that the spherical region around the planet is highly influenced by the gravity. We note that the red region along x = 0 is not the outflow but the horseshoe flow. We also note that the colour contour is saturated in the region coloured with red. The grey solid lines correspond to the specific gas streamlines. We highlighted the atmospheric recycling streamline in the thick white solid line. The red, orange, green, blue, and purple dashed lines are the circles of radius RBondi, 1.5 RBondi, 1 [H], 2 [H], and 3 [H].
Current usage metrics show cumulative count of Article Views (full-text article views including HTML views, PDF and ePub downloads, according to the available data) and Abstracts Views on Vision4Press platform.
Data correspond to usage on the plateform after 2015. The current usage metrics is available 48-96 hours after online publication and is updated daily on week days.
Initial download of the metrics may take a while.