Fig. A.1
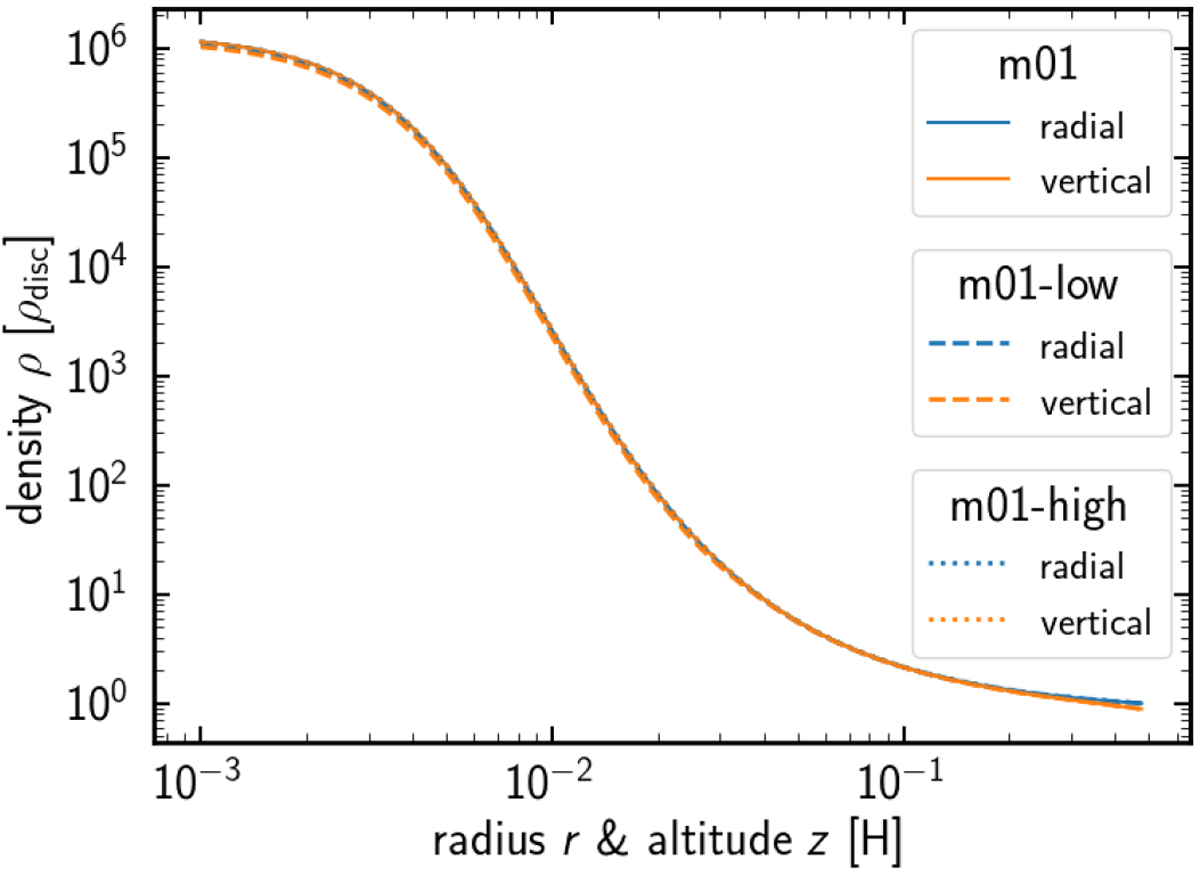
Gas density in the radial and vertical directions as a function of the radius, r, and altitude, z. These results are obtained from m01, m01-low, and m01-high runs at t = 30. The solid, dashed, and dotted lines correspond to the radial (blue) and vertical (orange) gas density around the planet obtained from the fiducial, low, and high resolution simulations, respectively. In the radial direction, we plotted the azimuthally averaged gas density. In the vertical direction, we plotted the gas density along the z-axis.
Current usage metrics show cumulative count of Article Views (full-text article views including HTML views, PDF and ePub downloads, according to the available data) and Abstracts Views on Vision4Press platform.
Data correspond to usage on the plateform after 2015. The current usage metrics is available 48-96 hours after online publication and is updated daily on week days.
Initial download of the metrics may take a while.