Fig. 10
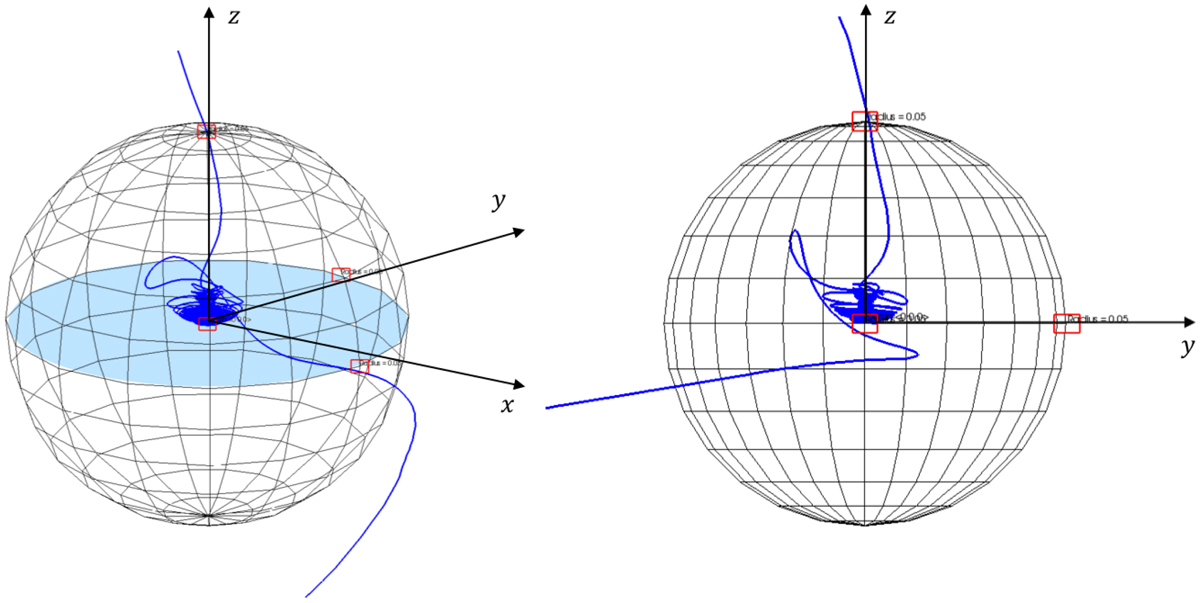
A single specific streamline of gas flow from m005 run at t = 10. The sphere in this figure represents the Bondi sphere of the planet. The blue solid line indicates the streamline which enters at the zenith of the Bondi sphere of the planet and circles around the planet several times, finally exiting near the midplane of the disc, which is coloured light blue. For convenience when plotting a streamline, the inflow point is located at (x, y, z)= (0.001, −0.001, 0.05), which is slightly different from P1 = (0, 0, 0.05; see Sect. 3.3).
Current usage metrics show cumulative count of Article Views (full-text article views including HTML views, PDF and ePub downloads, according to the available data) and Abstracts Views on Vision4Press platform.
Data correspond to usage on the plateform after 2015. The current usage metrics is available 48-96 hours after online publication and is updated daily on week days.
Initial download of the metrics may take a while.