Fig. 1
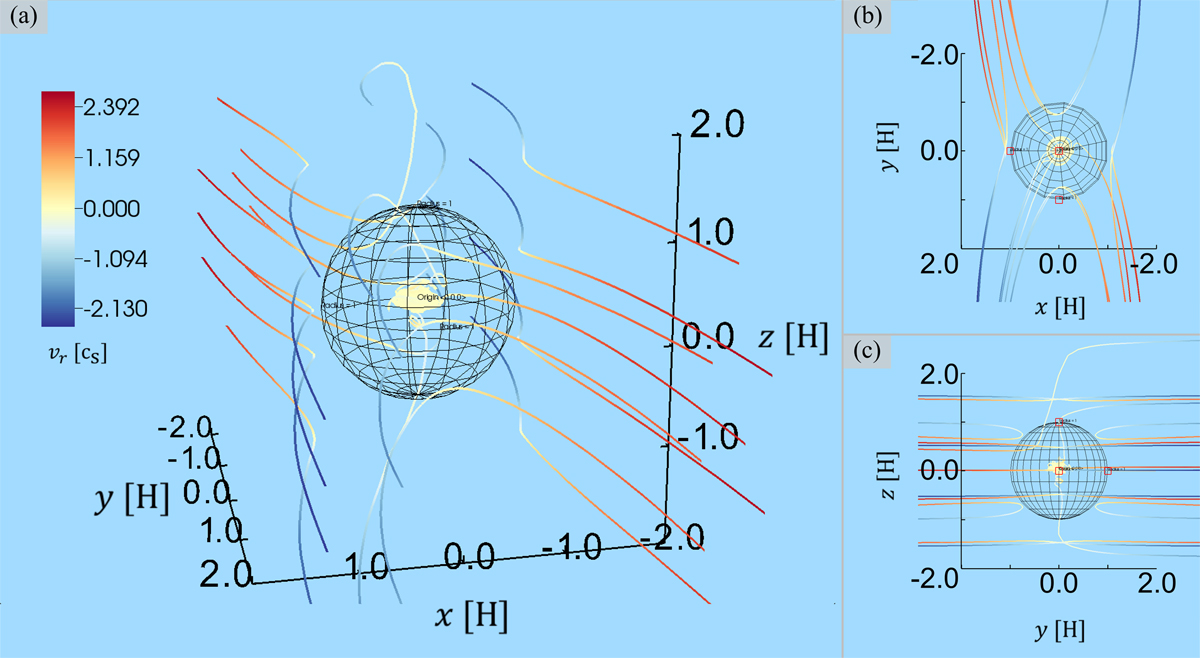
3D structure of the flow field obtained from m1 run at t = 100. The solid lines and the sphere represent the characteristic streamlines of gas flow around the planet and the Bondi region, respectively. The colour shows the radial velocity normalised by the isothermal sound speed. The regions where vr has a positive (outflow) or a negative value (inflow) are shown in blue and red, respectively. Panel a: perspective view of the flow field. Panel b: x–y plane viewedfrom the + z direction. Panel c: y–z plane viewedfrom the − x direction.
Current usage metrics show cumulative count of Article Views (full-text article views including HTML views, PDF and ePub downloads, according to the available data) and Abstracts Views on Vision4Press platform.
Data correspond to usage on the plateform after 2015. The current usage metrics is available 48-96 hours after online publication and is updated daily on week days.
Initial download of the metrics may take a while.