Fig. 8
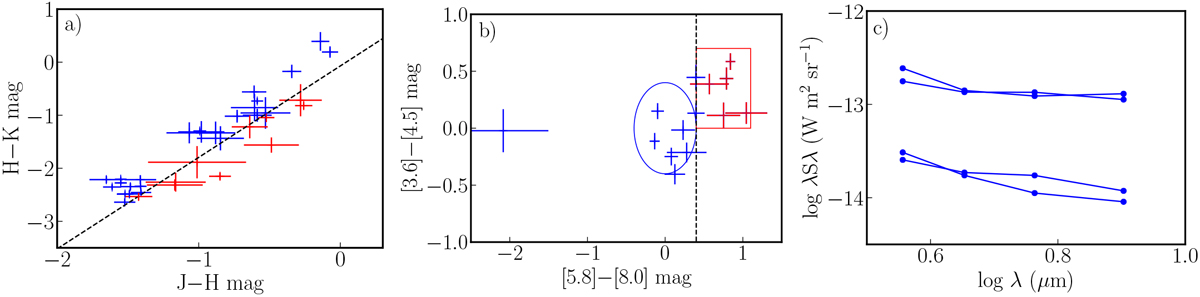
Panel a: J−H vs. H−K color–color diagram. The line represents the location of an O9V star depending on the reddening (Tokunaga 2000). Blue and red crosses represent the IR counterparts that are considered Class III YSO or stars and early YSOs (from Class 0 to Class II). Panel b: [3.6]− [4.5] vs. [5.8]−[8.0] color–colordiagram. The blue ellipse and red box represent the location of Class III YSO or stars and YSOs following the models of Allen et al. (2004). Red crosses represent Class II (or earlier) YSOs located right of the blue dashed line that delineates the Class II and Class III stars. Panel c: SED from 3.6 μm to 8 μm.
Current usage metrics show cumulative count of Article Views (full-text article views including HTML views, PDF and ePub downloads, according to the available data) and Abstracts Views on Vision4Press platform.
Data correspond to usage on the plateform after 2015. The current usage metrics is available 48-96 hours after online publication and is updated daily on week days.
Initial download of the metrics may take a while.