Fig. 4
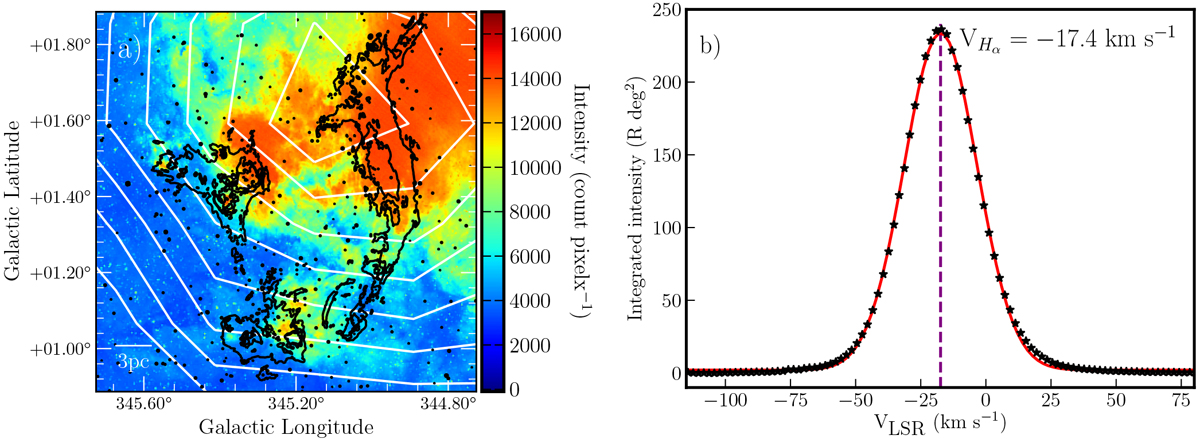
Panel a: Hα image from the SHS toward the G345.5+1.5 region. The black contours represent the 8 μm emission (100, 300, 500 mJy sr−1), and the white contours represent the integrated Hα emission (from 35 to 530 R km s−1 with 55 R km s−1 steps) from the WHAM-SS. Panel b: spatially integrated Hα emission where the star-points represent the data and the red curve represents the Gaussian fit to the data.
Current usage metrics show cumulative count of Article Views (full-text article views including HTML views, PDF and ePub downloads, according to the available data) and Abstracts Views on Vision4Press platform.
Data correspond to usage on the plateform after 2015. The current usage metrics is available 48-96 hours after online publication and is updated daily on week days.
Initial download of the metrics may take a while.