Free Access
Fig. 14
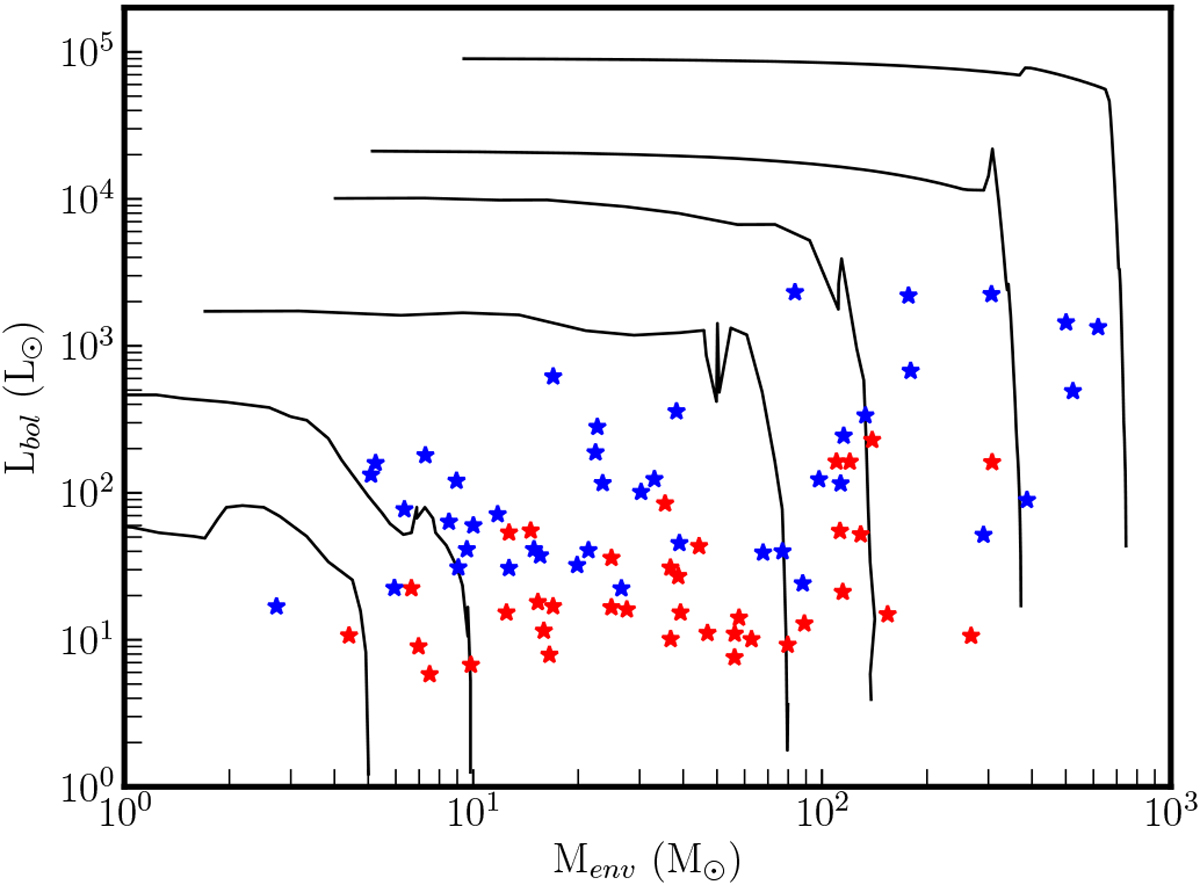
Lbol–Menv diagram with the evolutionary tracks of Molinari et al. (2008) and the sample of sources superimposed on it. Protostellar sources (with a 70 μm counterpart)are shown in blue and prestellar sources (without a 70 μm counterpart) in red.
Current usage metrics show cumulative count of Article Views (full-text article views including HTML views, PDF and ePub downloads, according to the available data) and Abstracts Views on Vision4Press platform.
Data correspond to usage on the plateform after 2015. The current usage metrics is available 48-96 hours after online publication and is updated daily on week days.
Initial download of the metrics may take a while.