Free Access
Fig. 8
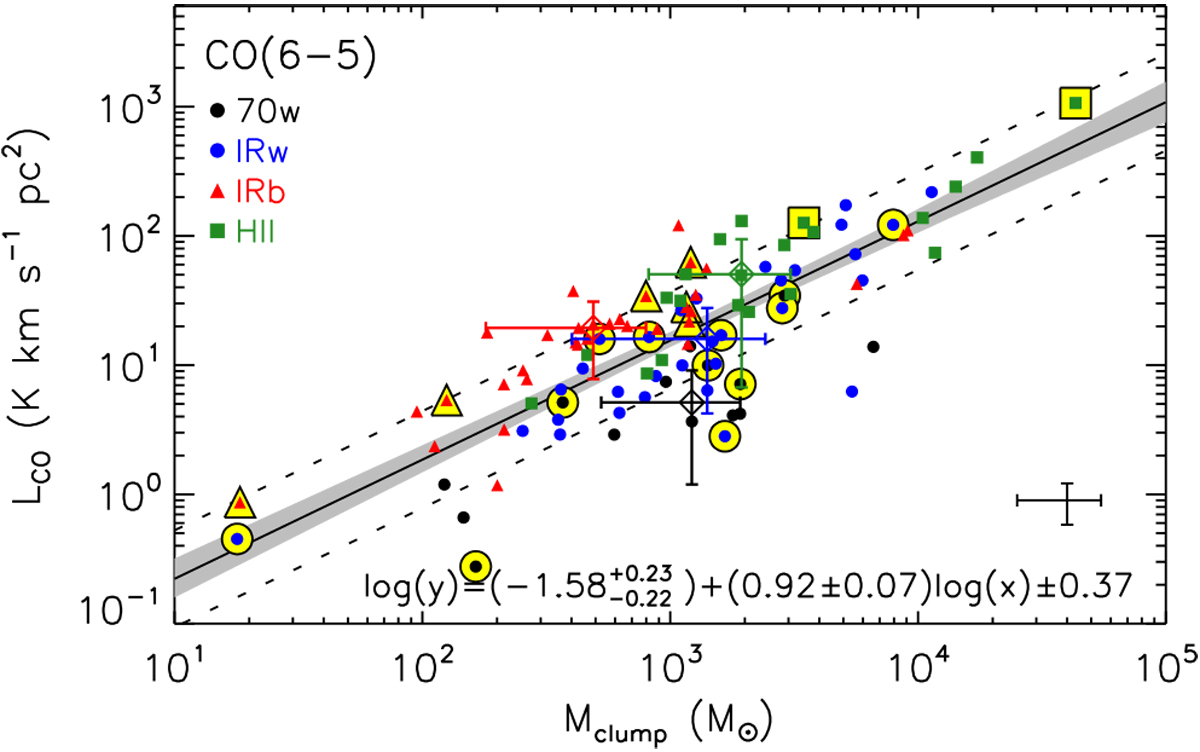
Same as the right panel of Fig. 7, but displaying the line luminosity of the CO (6–5) emission as a function of the mass of the clumps. Data points highlighted in yellow indicate those sources from which no signs of self-absorption features where identified in the spectrum convolved to 13.′′ 4.
Current usage metrics show cumulative count of Article Views (full-text article views including HTML views, PDF and ePub downloads, according to the available data) and Abstracts Views on Vision4Press platform.
Data correspond to usage on the plateform after 2015. The current usage metrics is available 48-96 hours after online publication and is updated daily on week days.
Initial download of the metrics may take a while.