Fig. 4
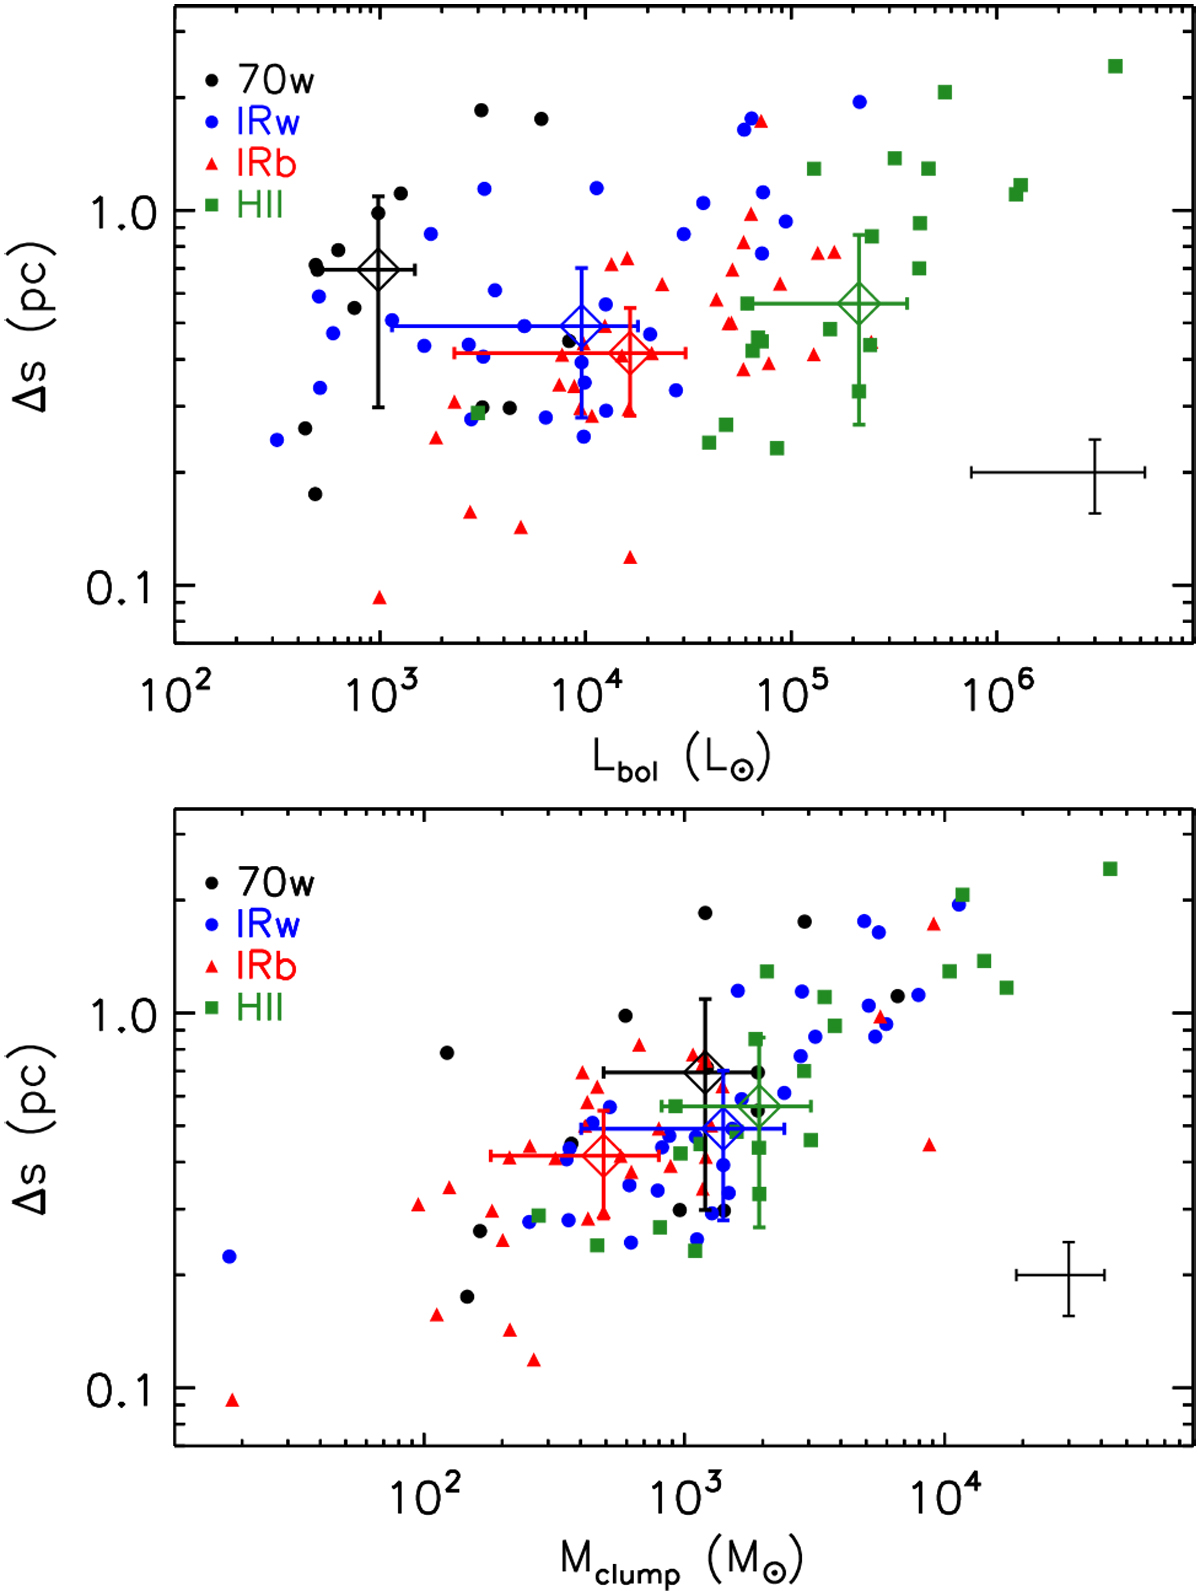
Size ofthe CO (6–5) emission towards the TOP100 sample versus the bolometric luminosity (top panel) and the mass (bottom panel) of the sources. The median values for each class are shown as open diamonds and their error bars correspond to the absolute deviation of the data from their median value. The typical uncertainty is shown by the error bars on the bottom right of each plot.
Current usage metrics show cumulative count of Article Views (full-text article views including HTML views, PDF and ePub downloads, according to the available data) and Abstracts Views on Vision4Press platform.
Data correspond to usage on the plateform after 2015. The current usage metrics is available 48-96 hours after online publication and is updated daily on week days.
Initial download of the metrics may take a while.