Fig. 3
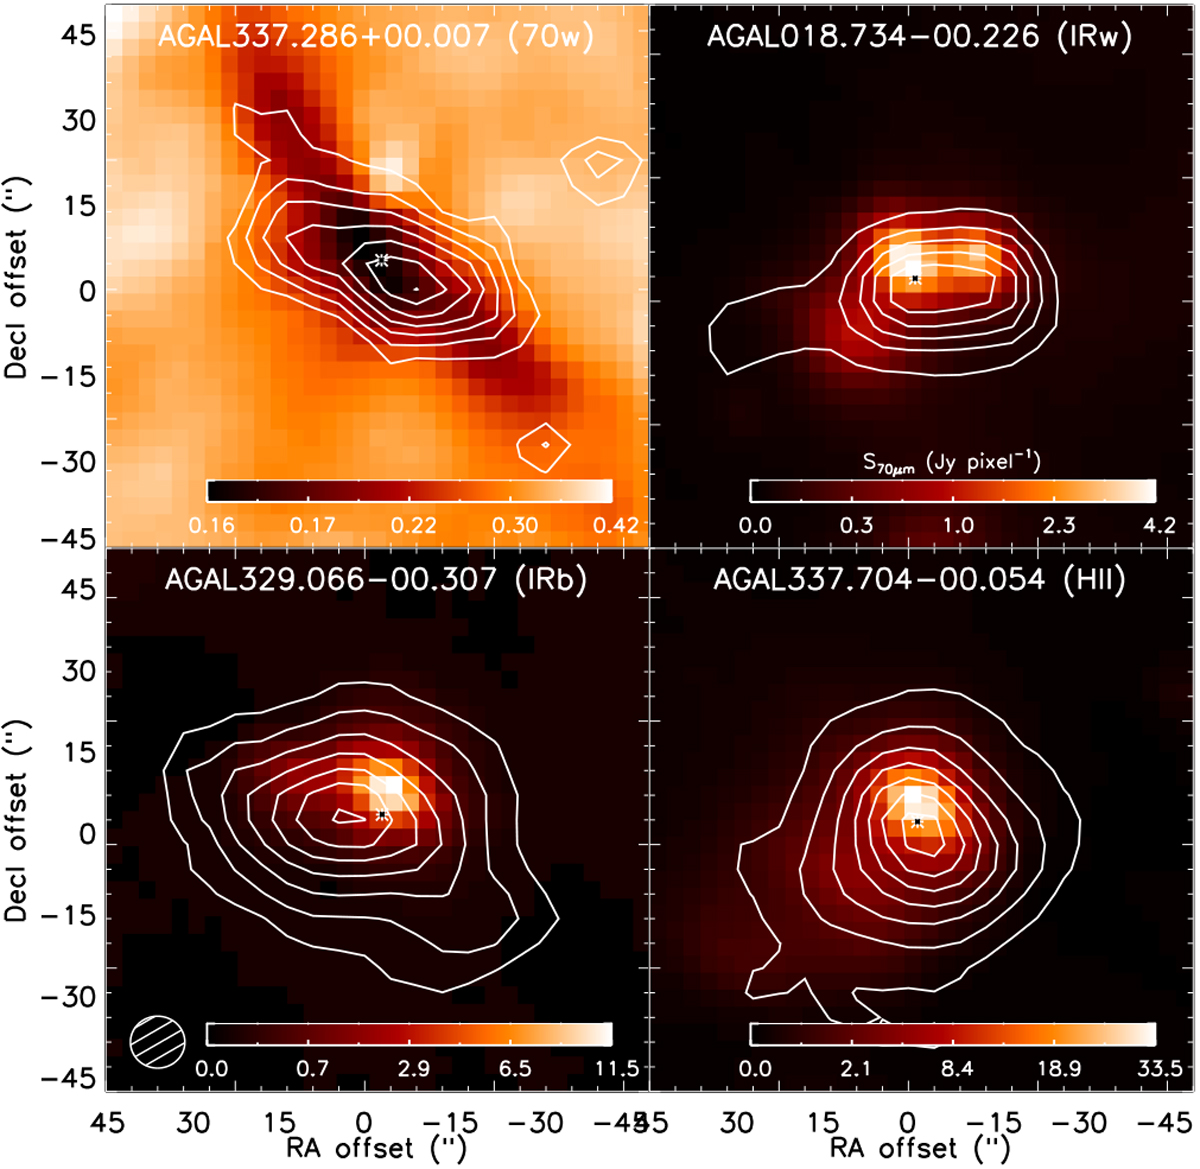
Distribution of the CO (6–5) emission of four representative clumps of each evolutionary classes of the TOP100 clumps. The CO contours are presented on top of the Herschel-PACS maps at 70 μm. Each 70 μm map is scaled in according to the colour bar shown in the corresponding panel. The CO contours correspond to the emission integrated over the full-width at zero power (FWZP) of the CO (6–5) line, andthe contour levels are shown from 20% to 90% of the peak emission of each map, in steps of 10%. The position of the CSC source from Contreras et al. (2013) is shown as a × symbol. Thebeam size of the CO (6–5) observations is indicated in the left bottom region.
Current usage metrics show cumulative count of Article Views (full-text article views including HTML views, PDF and ePub downloads, according to the available data) and Abstracts Views on Vision4Press platform.
Data correspond to usage on the plateform after 2015. The current usage metrics is available 48-96 hours after online publication and is updated daily on week days.
Initial download of the metrics may take a while.