Fig. C.5
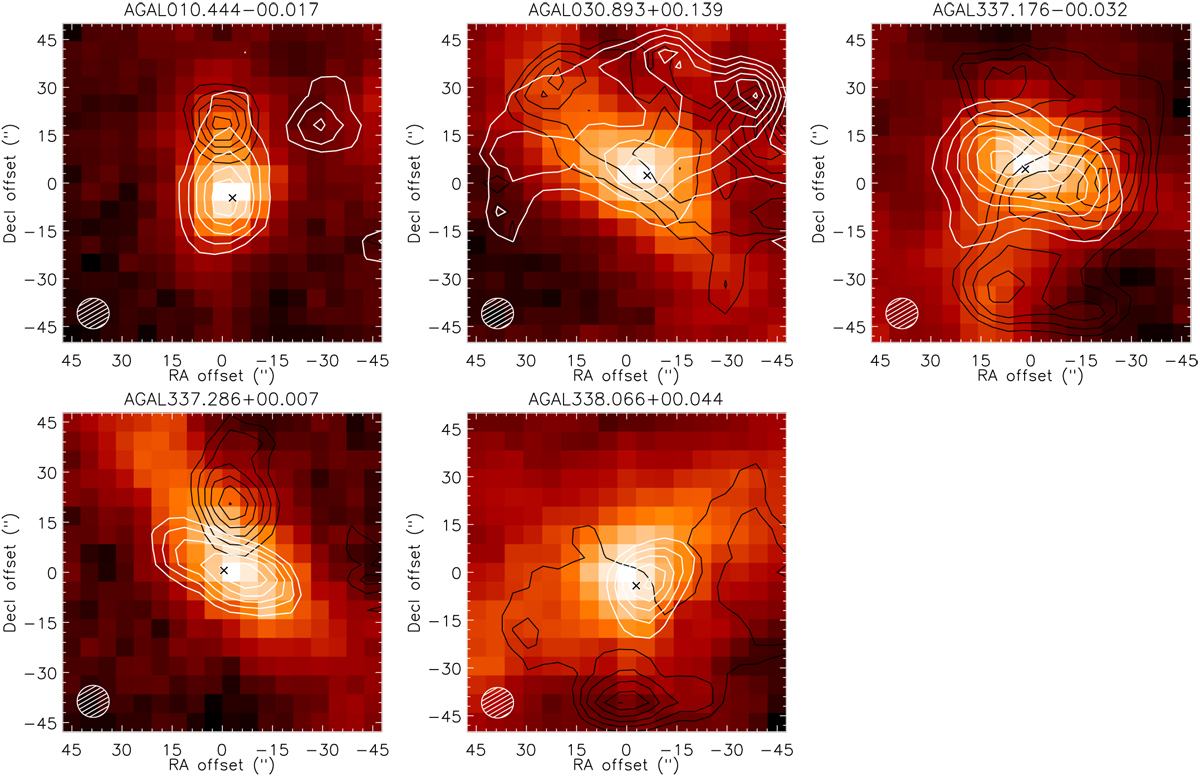
APEX-LABOCA images at 870 μm overlaid by the CO (6–5) emission contours (C1 component in white, C2 component in black; in both cases, the contours are from 30% to 90% of the peak emission of the corresponding component in steps of 10%) towards the TOP100 clumps. The position of the CSC source from Contreras et al. (2013) is shown as a × symbol.
Current usage metrics show cumulative count of Article Views (full-text article views including HTML views, PDF and ePub downloads, according to the available data) and Abstracts Views on Vision4Press platform.
Data correspond to usage on the plateform after 2015. The current usage metrics is available 48-96 hours after online publication and is updated daily on week days.
Initial download of the metrics may take a while.