Fig. C.1
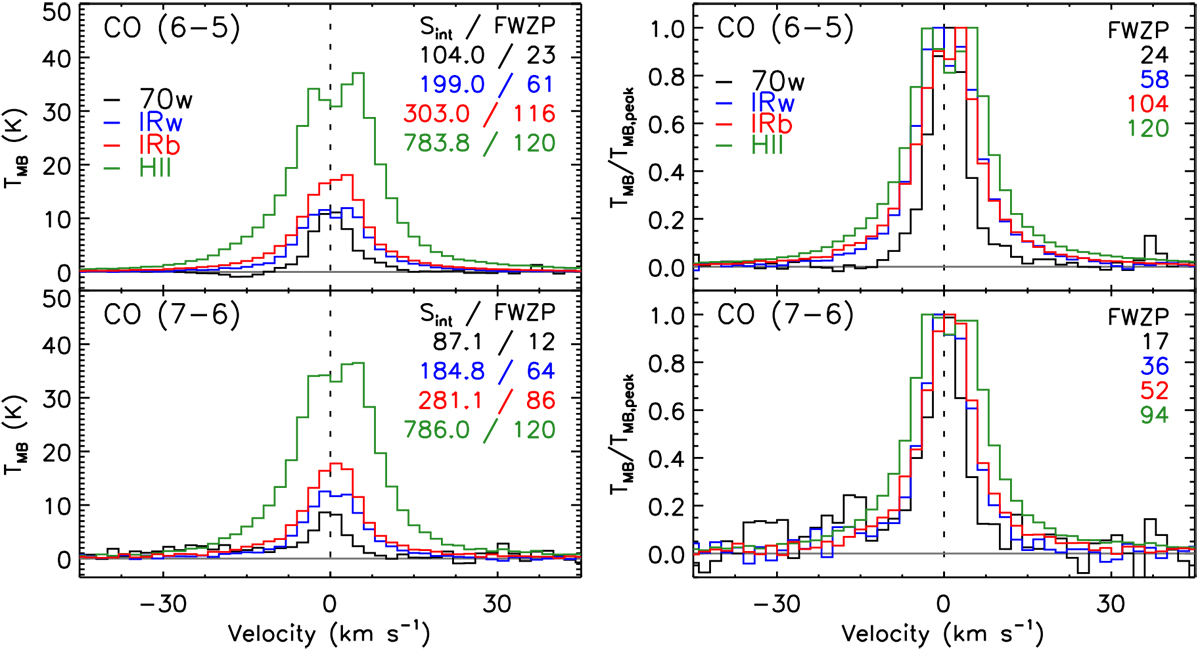
Leftpanels: average CO (6–5) and CO (7–6) spectra of each ATLASGAL class scaled to the median distance of the distance-limited sub-sample (d = 3.26 kpc). Right panels: same plot, but the average CO spectra were normalised by their peak intensity. The baseline level is indicated by the solid grey line. The black dashed line marks a velocity of 0 km s −1. The FWZP of the profiles are shown in the upper right side of the panels (in km s −1 units), together with the integrated intensity (Sint, in K kms−1 units) of theCO profiles shown in the left panels.
Current usage metrics show cumulative count of Article Views (full-text article views including HTML views, PDF and ePub downloads, according to the available data) and Abstracts Views on Vision4Press platform.
Data correspond to usage on the plateform after 2015. The current usage metrics is available 48-96 hours after online publication and is updated daily on week days.
Initial download of the metrics may take a while.