Fig. B.1
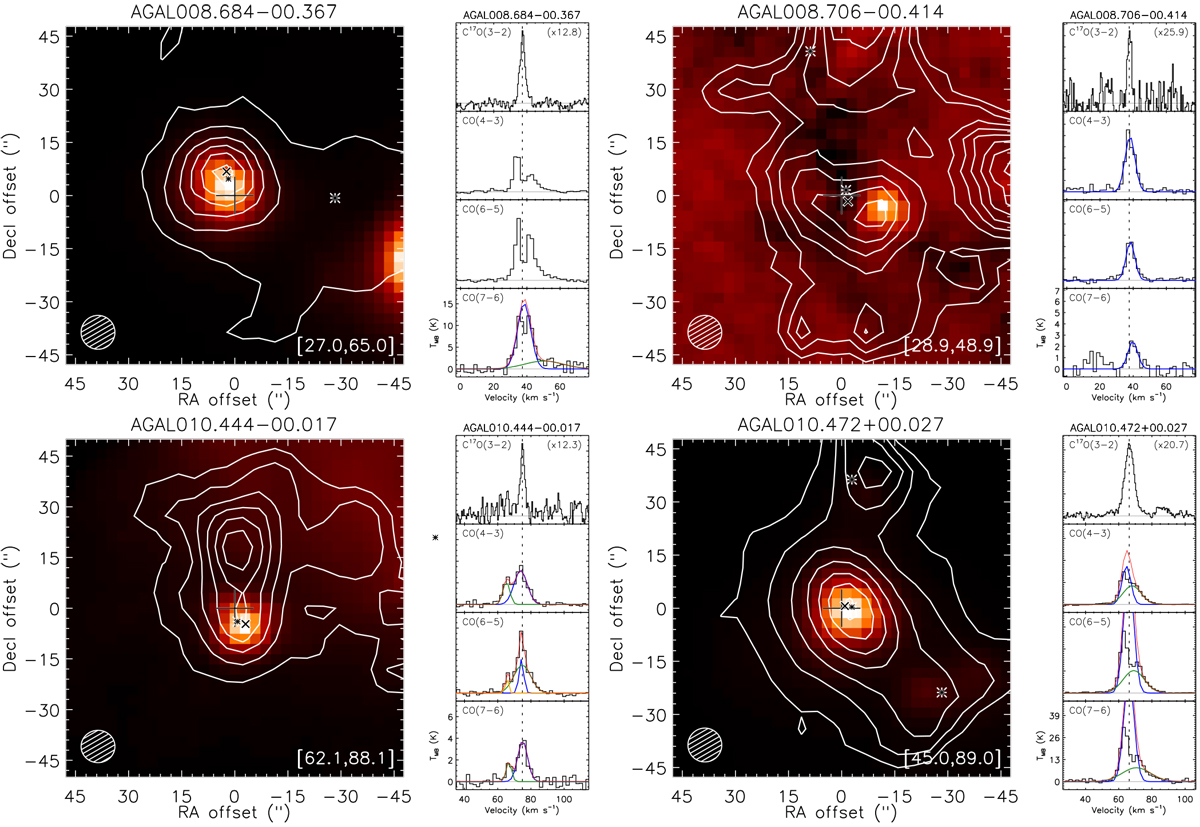
Leftpanels: false-colour Herschel/PACS images at 70 μm overlaid by the CO (6–5) emission contours towards the TOP100 source. The CO contours correspond to the emission integrated over the full-width at zero power (FWZP) of the CO (6–5) profile, the velocity range shown in the bottom right side of the image, and the contour levels are shown from 20% to 90% of the peak emission of each map, in steps of 10%. The (0,0) position of the map is shown as a + symbol, the position of the CSC source from Contreras et al. (2013) is shown as a × symbol and the dust continuum emission peaks from Csengeri et al. (2014) are shown as asterisks. Right, from top to bottom panel: C17O (2–1) or C18 O (1–0) from Giannetti et al. (2014), CO (4–3), CO (6–5) and CO (7–6) profiles towards the TOP100 sample, convolved into a fixed beam size of 13.′′4 (shown in black) and their fitted Gaussian components. The narrower Gaussian component fitted to the data is shown in blue, the second and broader component is shown in green and the third componentis shown in yellow. The sum of all Gaussian components is shown in red, except for the cases where a single component was fitted. The vertical dashed black line is placed at the rest velocity (Vlsr) of each source. The horizontal filled grey line displays the baseline of the data.
Current usage metrics show cumulative count of Article Views (full-text article views including HTML views, PDF and ePub downloads, according to the available data) and Abstracts Views on Vision4Press platform.
Data correspond to usage on the plateform after 2015. The current usage metrics is available 48-96 hours after online publication and is updated daily on week days.
Initial download of the metrics may take a while.