Fig. 12
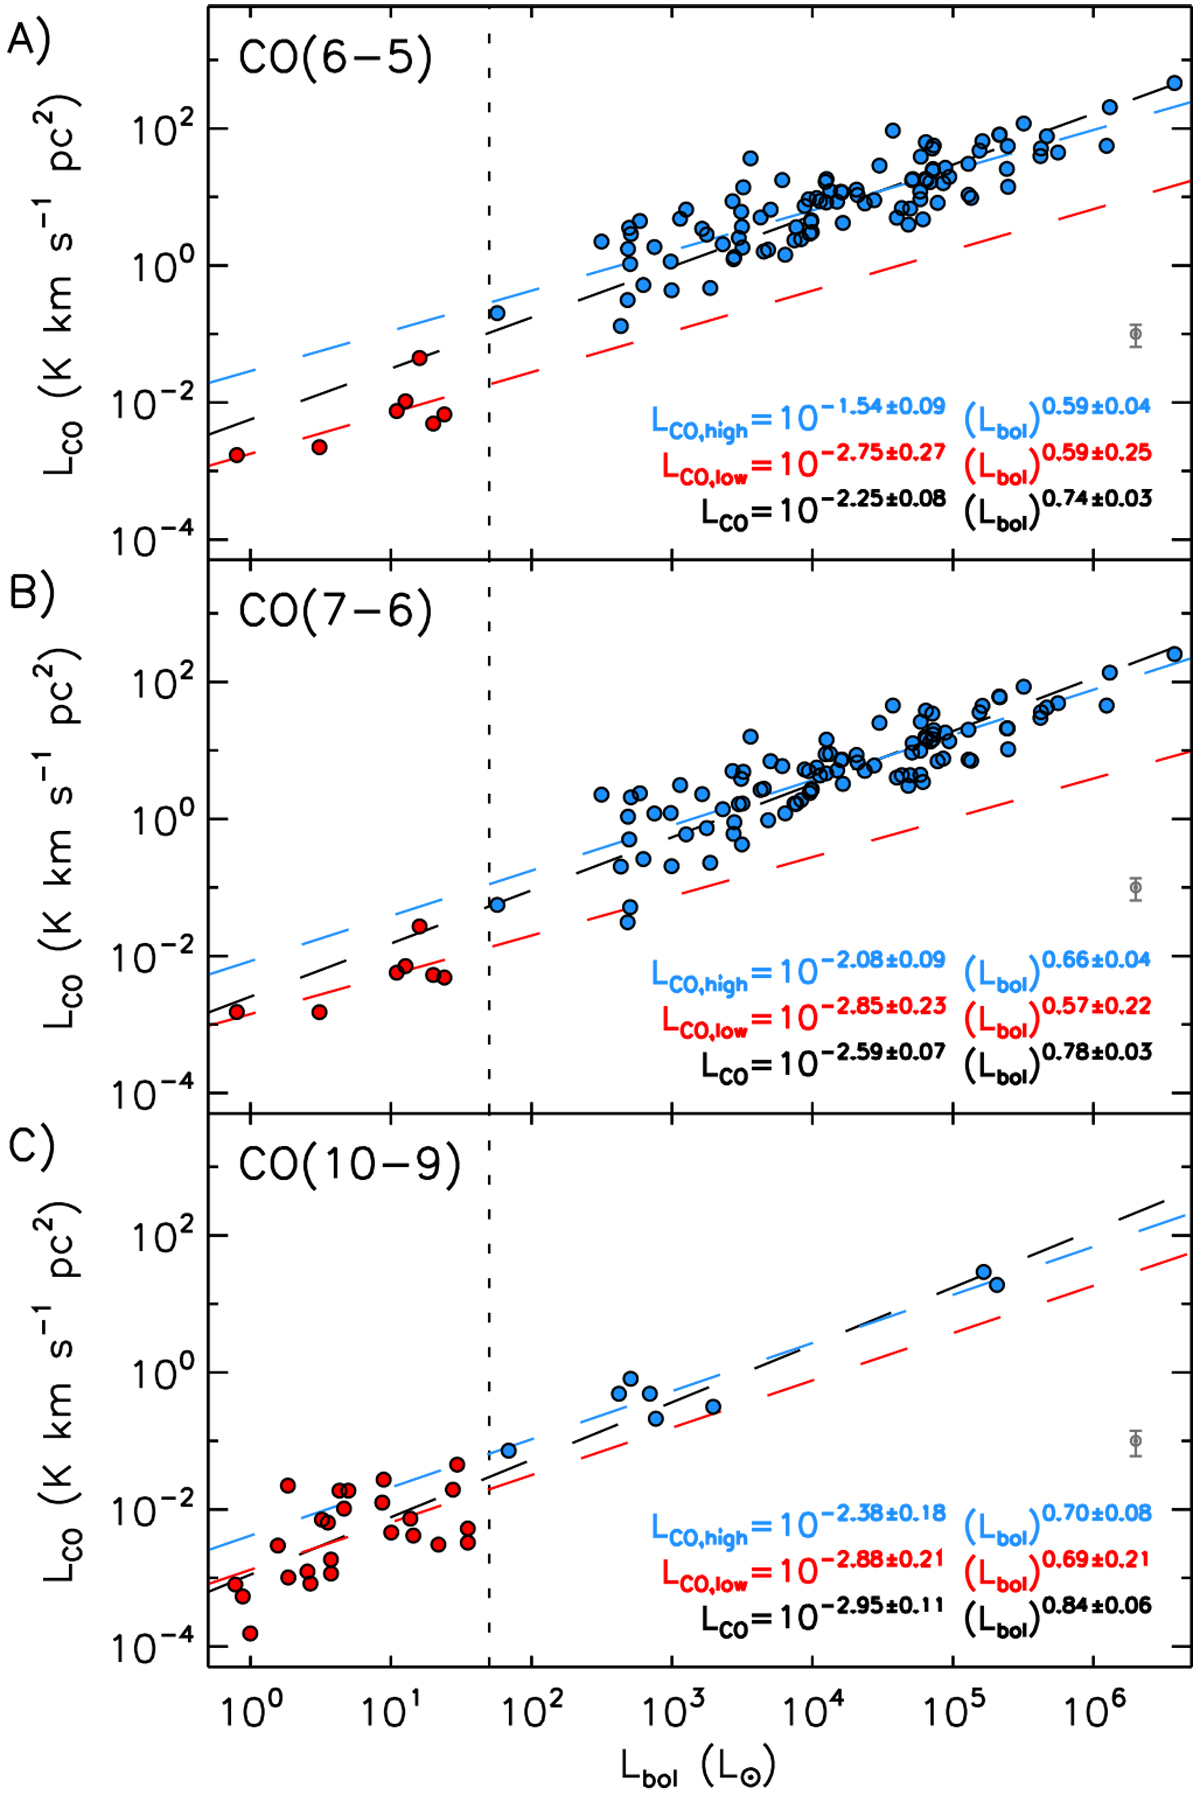
CO line luminosity as a function of the bolometric luminosity for the CO (6–5) (upper panel), CO (7–6) (middle panel) and CO (10–9) (bottom panel) transitions. The fits were performed on the whole dataset (all points, shown with black contours), on the low- and high-luminosity sub-samples (points filled in red and blue, respectively). The CO (6–5) and CO (7–6) data towards low-luminosity sources are from van Kempen et al. (2009a); the CO (10–9) data are from San José-García et al. (2013). The dashed vertical line at Lbol = 50 L⊙ marks the transition from low- to high-mass YSOs. The typical error bars are shown in the bottom right side of the plots.
Current usage metrics show cumulative count of Article Views (full-text article views including HTML views, PDF and ePub downloads, according to the available data) and Abstracts Views on Vision4Press platform.
Data correspond to usage on the plateform after 2015. The current usage metrics is available 48-96 hours after online publication and is updated daily on week days.
Initial download of the metrics may take a while.