Fig. 10
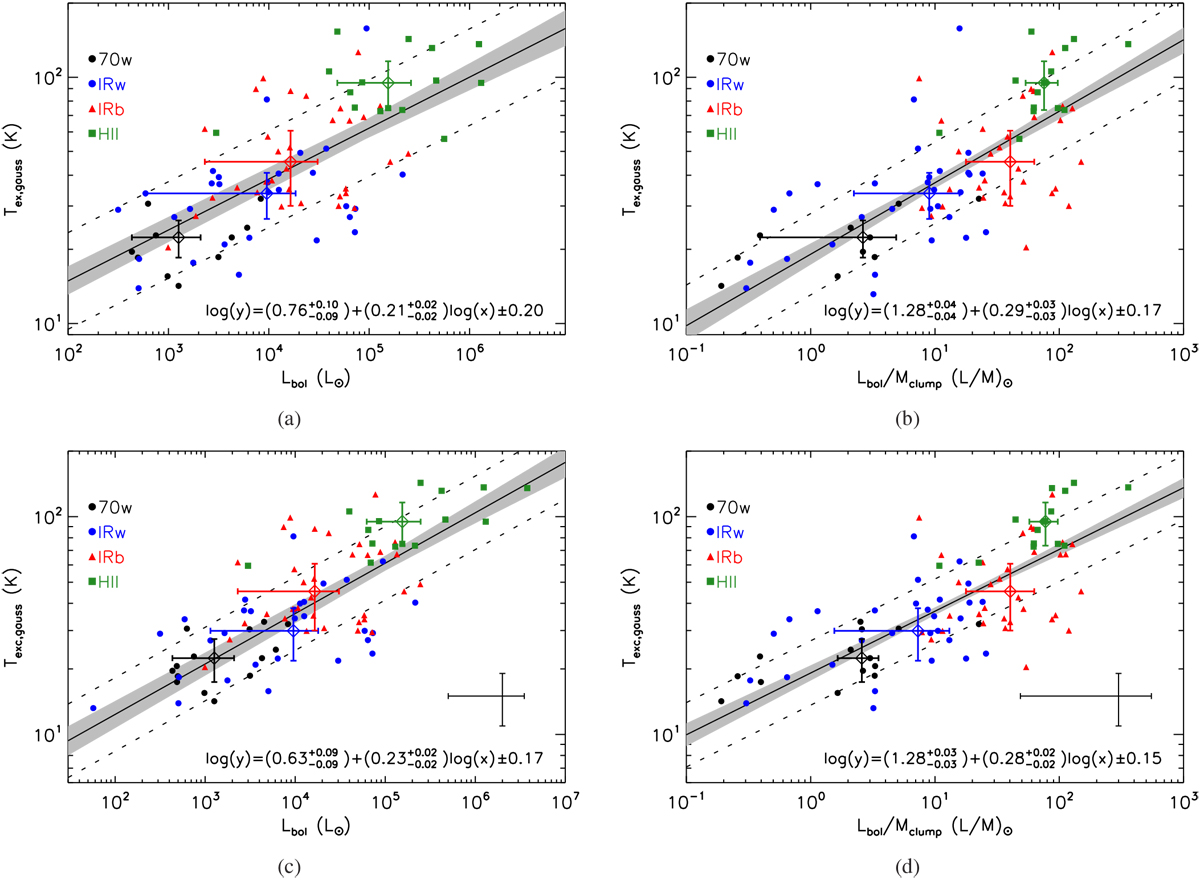
Excitation temperature of the CO (6–5) line versus the bolometric luminosity of the TOP100 clumps (left panels) and the luminosity-to-mass ratio (right panels). The excitation temperature was derived using the peak of the Gaussian fit of the CO profiles. The median values for each class are shown as open diamonds and their error bars correspond to the median absolute deviation of the data from their median value. The black solid line is the best fit, the light grey shaded area indicates the 68% uncertainty, and the dashed lines show the intrinsic scatter (ϵ) of the relation. The best fit to the data is indicated by the filled black line.
Current usage metrics show cumulative count of Article Views (full-text article views including HTML views, PDF and ePub downloads, according to the available data) and Abstracts Views on Vision4Press platform.
Data correspond to usage on the plateform after 2015. The current usage metrics is available 48-96 hours after online publication and is updated daily on week days.
Initial download of the metrics may take a while.