| Issue |
A&A
Volume 621, January 2019
|
|
|---|---|---|
| Article Number | A110 | |
| Number of page(s) | 12 | |
| Section | Planets and planetary systems | |
| DOI | https://doi.org/10.1051/0004-6361/201834305 | |
| Published online | 15 January 2019 | |
The GAPS Programme with HARPS-N at TNG
XVIII. Two new giant planets around the metal-poor stars HD 220197 and HD 233832★,★★
1
Dipartimento di Fisica, Università degli Studi di Torino,
Via Pietro Giuria 1,
10125
Torino,
Italy
2
INAF – Osservatorio Astrofisico di Torino,
Via Osservatorio 20,
10025
Pino Torinese,
Italy
e-mail: domenico.barbato@inaf.it
3
INAF – Osservatorio Astrofisico di Catania,
Via S. Sofia 78,
95123,
Catania,
Italy
4
Dipartimento di Fisica e Astronomia “G. Galilei”,
Università di Padova,
Vicolo dell’Osservatorio 3,
35122 Padova,
Italy
5
INAF – Osservatorio Astronomico di Padova,
Vicolo dell’Osservatorio 5,
35122,
Padova,
Italy
6
Instituto de Astrofísica e Ciências do Espaço, Universidade do Porto, CAUP,
Rua das Estrelas,
4150-762
Porto,
Portugal
7
Departamento de Física e Astronomia, Faculdade de Ciências, Universidade do Porto,
Rua do Campo Alegre,
4169-007
Porto,
Portugal
8
INAF – Osservatorio Astronomico di Palermo,
Piazza del Parlamento 1,
90134,
Palermo,
Italy
9
INAF – Osservatorio Astronomico di Trieste,
Via Tiepolo 11,
34143
Trieste,
Italy
10
INAF – Osservatorio Astronomico di Brera,
Via E. Bianchi 46,
23807 Merate (LC),
Italy
11
Fundación Galileo Galilei – INAF,
Rambla José Ana Fernandez Pérez 7,
38712
Breña Baja,
TF,
Spain
12
INAF – Osservatorio Astronomico di Capodimonte,
Salita Moiariello 16,
80131,
Napoli,
Italy
13
Thüringer Landessternwarte Tautenburg,
Sternwarte 5,
07778
Tautenburg,
Germany
14
Dipartimento di Fisica, Università di Roma Tor Vergata,
Via della Ricerca Scientifica 1,
00133
Roma,
Italy
15
Max Planck Institute for Astronomy,
Königstuhl 17,
69117
Heidelberg,
Germany
16
INAF – Osservatorio Astronomico di Cagliari,
Via della Scienza 5,
09047 Selargius (CA),
Italy
17
INAF – Osservatorio Astrofisico di Arcetri,
Largo E. Fermi 5,
50125
Firenze,
Italy
Received:
23
September
2018
Accepted:
17
November
2018
Context. Statistical studies of exoplanets have shown that giant planets are more commonly hosted by metal-rich dwarf stars than low-metallicity stars, while no such correlation is evident for lower mass planets. The search for giant planets around metal-poor stars and the estimate of their occurrence fp is an important element in providing support to models of planet formation.
Aims. We present results from the HARPS-N search for giant planets orbiting metal-poor (− 1.0 ≤[Fe/H] ≤−0.5 dex) stars in the northern hemisphere, complementing a previous HARPS survey on southern stars in order to update the estimate of fp.
Methods. High-precision HARPS-N observations of 42 metal-poor stars were used to search for planetary signals to be fitted using differential evolution Markov chain Monte Carlo single-Keplerian models. We then joined our detections to the results of the previous HARPS survey on 88 metal-poor stars to provide a preliminary estimate of the two-hemisphere fp.
Results. We report the detection of two new giant planets around HD 220197 and HD 233832. The first companion has Msin i = 0.20−0.04+0.07 MJup and an orbital period of 1728−80+162 days, and for the second companion, we find two solutions of equal statistical weight with periods of 2058−40+47 and 4047−117+91 days and minimum masses of 1.78−0.06+0.08 and 2.72−0.23+0.23 MJup, respectively. Joining our two detections with the three from the southern survey, we obtain a preliminary and conservative estimate of the global frequency of fp = 3.84 −1.06+2.45% for giant planets around metal-poor stars.
Conclusions. The two new giant planets orbit dwarf stars at the metal-rich end of the HARPS-N metal-poor sample. This corroborates previous results that suggested that giant planet frequency is still a rising function of the host star [Fe/H]. We also note that all detections in the overall sample are giant long-period planets.
Key words: techniques: radial velocities / methods: data analysis / planetary systems / stars: abundances / stars: individual: HD 220197 / stars: individual: HD 233832
Based on observations made with the HARPS-N spectrograph on the Italian Telescopio Nazionale Galileo (TNG) operated on the island of La Palma (Spain) by the INAF – Fundación Galileo Galilei (Spanish Observatorio del Roque de los Muchachos of the Instituto de Astrofísica de Canarias).
RV data (Table 5) are only available at the CDS via anonymous ftp to cdsarc.u-strasbg.fr (130.79.128.5) or via http://cdsarc.u-strasbg.fr/viz-bin/qcat?J/A+A/621/A110
© ESO 2019
1 Introduction
Amongst the physical properties of planet-host stars, mass and metallicity seem to have the greatest impact on promoting the formation of giant (M > 20 M⊕) planets; many studies have shown for a long time that M dwarfs with M* < 0.5 M⊙ are less likely tohost a Jupiter-like planet than Sun-like or more massive F and G main-sequence stars (Butler et al. 2004; Johnson et al. 2007, 2010; Bonfils et al. 2013), and that metal-rich stars have a much higher probability to be orbited by at least one giant planetthan lower metallicity stars (Gonzalez 1997; Santos et al. 2001, 2004; Sozzetti 2004; Fischer & Valenti 2005; Sozzetti et al. 2009; Mortier et al. 2012).
The positive correlation between stellar metallicity and occurrence of giant planets has been of special interest in recent years, especially since no such correlation is found between host star metallicity and frequency of sub-Neptunian (R < 4 R⊕, M sin i < 10 M⊕) planets (Udry et al. 2006; Sousa et al. 2008, 2011; Mayor et al. 2011; Buchhave et al. 2012; Courcol et al. 2016). In particular, Mortier et al. (2012) reported that the fraction of stars hosting a giant planet rises from 5% for solar metallicity values to 25% for metallicities that are twice that of the Sun; these conclusions are also supported by results from the Kepler mission (see e.g. Buchhave et al. 2018).
The correlation between host star metallicity [Fe/H] and frequency of giant planets is usually seen as strong evidence favouring core-accretion over disc-instability formation models for giant planets. In the core-accretion model (Pollack et al. 1996; Ida & Lin 2004; Mordasini et al. 2009, 2012), giant planets are formed from the accretion of material into solid cores until they are massive enough (~10 M⊕) to trigger a rapid agglomeration of gas; this process is more efficient in metal-rich discs. In the disc-instability model (Boss 1997, 2002, 2006; Mayer et al. 2002), giant planets form directly from the collapse of self-gravitating clumps of gas after the disruption of the proto-planetary disc and do not require the presence of solid cores.
Recent works also showed interesting correlations between metallicity regimes and the class of giant planets found around the host star, stressing the importance of stellar metallicity as a proxy for the chemical compositions of protoplanetary discs and its role in driving planet formation and dynamical evolution. Metal-poor stars seem to host planets that are more massive and have longer periods than those hosted by metal-rich stars. Sozzetti (2004) argued for an anti-correlation between orbital period and host star metallicity, which has more recently also been supported by Mulders et al. (2016) based on an analysis of Kepler candidates; Santos et al. (2017) also reported that stars with planets more massive than 4 MJup are on average more metal-poor than stars hosting less massive planets.
Similarily, Maldonado et al. (2015a) reported that stars hosting hot Jupiters (defined as giant planets with semimajor axis a < 0.1 AU) tend to have slightly higher metallicities than stars orbited by more distant giants, further noting that no hot Jupiters are found around stars with metallicities lower than −0.6 dex. This result was confirmed by the analysis of 59 cool-Jupiter hosts and 29 hot-Jupiter hosts in Maldonado et al. (2018), who reported a significant deficit of hot-Jupiter planet hosts below +0.2 dex compared to cool-Jupiter planet hosts. They interpreted the different chemical characteristics of the host stars of these planetary classes as distinct planetary populations with different evolutionary histories. The same study also noted that metal-poor stars hosting cool Jupiters have higher α-element abundances than those hosting hot Jupiters, suggesting that in metal-poor protoplanetary discs an overabundance of elements such as Mg, Si, and Ti may compensate for the lack of Fe in allowing the formation of giant planets according to the core-accretion model. Previous studies (Haywood 2008, 2009; Kang et al. 2011; Adibekyan et al. 2012a,b) have similarly noted that planet-hosting stars with low [Fe/H] tend to be enhanced in α-elements.
Buchhave et al. (2018) also found that stars hosting Jupiter analogues have average metallicities close to that of the Sun, while hot Jupiters as well as cool eccentric Jupiters are found around stars with higher metallicities. This suggests that planet–planet scattering mechanisms that produce more eccentric orbits are more common in metallic protoplanetary environments.
The correlation between stellar [Fe/H] and the occurrence of giant planets has inspired the search for such planetary bodies around stars that are specifically selected for their low [Fe/H] values, especially to determine the metallicity limit below which no giant companions are formed. In 2003, a three-years survey using HIRES on the Keck I telescope was started (see Sozzetti et al. 2006, 2009). The survey observed ~200 metal-poor (− 2 ≤[Fe/H] ≤−0.6 dex) stars and obtained a ~10 m s−1 Doppler precision, but found no candidate planet. The null detection was therefore used to provide a 1σ upper limit of 0.67% for the frequency of massive planets orbiting low-metallicity stars at orbital periods P < 3 yr.
One of the High Accuracy Radial velocity Planet Searcher (HARPS, see Mayor et al. 2003) guaranteed time observations (GTO) sub-samples was also explicitly build to search for giant planets orbiting metal-poor stars in the southern hemisphere, using the high precision of the spectrograph (~1 m s−1) to evaluate their frequency and low-metallicity formation limit. The study of this 88 metal-poor stars sub-sample has found a total of three giant planets (HD 171028 b, HD 181720 b, and HD 190984 b) with minimum masses of 1.98, 0.37, and 3.1 MJup and orbital periods of 550, 956, and 4885 days, respectively. In addition to these detections, one as yet unconfirmed planet was proposed around star HD 107094, with a minimum mass of 4.5 MJup and a period of 1870 days (see Santos et al. 2007, 2010a, 2011). From these three giant planets out of 88 target stars,Santos et al. (2011) derived a frequency of Jupiter-mass planets around metal-poor stars of  , which increases to
  when considering only the 34 stars in the metallicity range in which the three detected planets were found and with more than three measurements ([Fe/H] between −0.40 and −0.60 dex). Moreover, the null detection in the 32 sample stars with [Fe/H] < −0.60 dex and at least six datapoints implies a frequency of fp < 5% for this sub-sample. All of these results are presented as conservative estimates because existing giant companions on short periods maynot have been detected as a result of less than optimal sampling, few measurements, and considering a possible fourth detection around HD 107094 and several linear trends in the analyzed sample. Interestingly, Santos et al. (2011) further noted that the four stars around which the three planets and one candidate were observed have [Fe/H] values (−0.48, −0.53, −0.49, and −0.51 dex) at the high-metallicity end of the sample, suggesting that the giant planet frequency is a rising function of the host star metallicity even for metal- poor stars.
A follow-up analysis of the metal-poor samples studied in Sozzetti et al. (2009) and Santos et al. (2011) was presented in Mortier et al. (2012), showing that while no hot Jupiters were found, and they are therefore rare around such metal-poor stars (fp < 1%), the fraction of long-period giant planets is much higher, increasing from fp < 2.35% at [Fe/H] ≤ −0.7 dex to  for stars with [Fe/H] > −0.7 dex.
Furthermore, Johnson & Li (2012) found that the critical value for [Fe/H] below which giant planets are not formed is a function of planetary distance r from the host star, estimating a lower limit for this value of [Fe/H]crit ≃−1.5 + logr. Interestingly, claims of giant planets that were found around exceptionally metal-poor ([Fe/H] approximately −2.0 dex) stars were disproved by follow-up studies, such as the planetary systems proposed around the stars HIP 11952 (see Desidera et al. 2013; Müller et al. 2013) and HIP 13044 (see Jones & Jenkins 2014). We also note that at the time of writing, the dwarf star with the lowest metallicity known to host any giant planet is HD 155358 with [Fe/H] = − 0.62 dex, hosting two planets with minimum masses of 0.99 and 0.82 MJup t periods of 194.3 and 391.9 days (see Robertson et al. 2012; Santos et al. 2013).
In this paper, we present results from the survey conducted with the High Accuracy Radial velocity Planet Searcher in the Northern hemisphere (HARPS-N, see Cosentino et al. 2012) at the Telescopio Nazionale Galileo (TNG) in La Palma within the observational programme Global Architecture of Planetary Systems (GAPS, see Covino et al. 2013; Desidera et al. 2013) on a northern metal-poor sample. We report the detection of two giant planets around stars HD 220197 and HD 233832 and a preliminary revision of the giant planet frequency fp. In Sect. 2, we describe the selection and observations conducted with HARPS-N in our northern sample. We characterise the host stars HD 220197 and HD 233832 in Sect. 3 before we present our orbital solutions in Sect. 4 and the update of planetary frequency in Sect. 5. Finally, we conclude and discuss the overall results in Sect. 6.
2 HARPS-N metal-poor sample
The selected stars were drawn from the sample of ~200 stars previously observed with Keck/HIRES in a similar search for giant planetary companions around metal-poor (− 2.0 ≤[Fe/H] ≤−0.6 dex) stars (see Sozzetti et al. 2006, 2009) in which the targets selected from the Carney-Latham and Ryan samples of metal-poor, high-velocity field stars (see Ryan 1989; Ryan & Norris 1991; Carney et al. 1996) were surveyed with a ~10 m s−1 precision. A sub-sample of 42 stars was therefore selected for observation with HARPS-N with a metallicity of approximately between −1.0 and −0.5 dex and a magnitude V < 11.0 mag so to allow for a photon noise precision of ~1 m s−1 and to select chromospherically quiet targets. The distributions of metallicity [Fe/H], magnitude V, and effective temperatureTeff are shown in Fig. 1.
The 42-stars sample thus selected was monitored with HARPS-N from August 2012 to August 2018, obtaining a total of 1496 datapoints (a mean of 35 observations per star) with a mean error of 1.25 m s−1. The mean exposure time was 800 s and the mean signal-to-noise ratio (S/N) was 89.30.
The high-precision time series we obtained were searched for significant (false-alarm probability, FAP, ≤ 1%) signals via ageneralized Lomb-Scargle periodogram using the IDL routine GLS (Zechmeister & Kürster 2009). When significant signals were detected, a single-planet orbital solution was tried out.
Two stars in our sample (HD 220197, HD 233832) showed a significant periodogram peak for which a successful search for a planetary solution was made (see Sect. 4). They are therefore the focus of our analysis. The complete list of measurements collected for these two stars is listed in Table 5. In Fig. 2, we show as red circles the time series of the radial velocities collected for HD 220197 and HD 233832 and the activity indexes bisector inverse span (BIS), full width at half maximum (FWHM) of the CCF,  , ΔV (see Nardetto et al. 2006), and the new indicator Vasy(mod) defined in Lanza et al. (2018) to avoid the known spurious dependencies with radial velocity variations of the indicator Vasy defined in Figueira et al. (2013, 2015). In the FWHM datasets the effect of a defocusing affecting the first portion of the HARPS-N observations is evident as a trend in the datapoints, specifically affecting the first 31 datapoints collected for HD 220197 and the first 11 for HD 233832. This instrumental defocusing was corrected in March 2014 and is absent from the following data. To correct for this defocusing and improve the quality of the collected data by removing spurious correlations between radial velocities and FWHM introduced by this instrumental effect, we followed Benatti et al. (2017), who encountered the same effect when they characterized the planetary system orbiting HD 108874 with HARPS-N data within the same time period. After removing two spurious observations at epoch 2456181.62 and 2456602.56 for HD 220197 (see Sect. 4 for details), we performed a polynomial fit on the FWHM data affected by the defocusing and considered the best-fit residuals as corrected FWHM. We report the values of the corrected FWHM in the eighth column of Table 5 alongside the uncorrected FWHM values. This correction successfully lowers the correlation between radial velocities and FWHM; for HD 220197 we find a Spearman correlation r between these two quantities of − 0.578 before correction and of − 0.277 after correction, while for HD 233832, r varies from − 0.2466 to 0.008 after correcting for the defocusing. In the following analysis we use the corrected time series throughout.
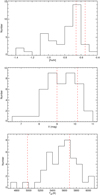 |
Fig. 1 Metallicity, magnitude, and effective temperature distribution of the HARPS-N metal-poor sample discussed in this work. The values of stars HD 220197 and HD 233832 are indicated by the vertical dashed red lines. |
Stellar properties.
3 Stellar properties: HD 220197 and HD 233832
Catalogue stellar parameters for the two host stars are provided in Table 1. The stellar parameters and elemental abundances obtained from our spectroscopic analysis based on HARPS-N spectra are shown in Table 3.
Effective temperature Teff, surface gravity logg, microturbulence velocity ξ, and iron abundance [Fe/H] were measured through equivalent widths and using of a grid of Kurucz model atmospheres (Kurucz 1993) and the spectral analysis package MOOG (Sneden 1973). In particular, Teff was derived by imposing that the Fe I abundance does not depend on the excitation potential of the lines, ξ by imposing that the Fe I abundance is independent of the line equivalent widths, and log g by the Fe I/Fe II ionisation equilibrium condition. To account for possible differences in the calculation of equivalent widths, we used two different softwares, namely IRAF (Tody 1993) and ARES2 (Sousa et al. 2015), to compute them from the HARPS-N master spectra for HD 220197 and HD 233832 built from the co-addition of the individual spectra used for the radial velocity measurements. The values of Teff, log g, ξ, and [Fe/H] obtained from these two measurements of equivalent widths are shown in the first and second columns of Table 2, respectively, and are generally in good agreement. In the following, we use the weighted mean of each parameter thus obtained, shown in Table 3. The differential elemental abundances with respect to the Sun were measured from our HARPS-N spectra following the method detailed in Damasso et al. (2015), Biazzo et al. (2015), Santos et al. (2013), and references therein. The first value of the uncertainty on elemental abundance is obtained from the measure of the equivalent width, whilethe second value is the root sum square of the errors on the abundance due to the uncertainties in stellar parameters Teff, log g, and ξ.
To compensate for the model dependencies, we estimated the stellar mass and radius as the weighted mean of the values obtained from the online tool PARAM 1.3 (see da Silva et al. 2006) and those obtained from the Yonsei-Yale isochrones (see Yi et al. 2008).
It can be noted that the photometric Teff, [Fe/H], and M* reported in Sozzetti et al. (2009; 5564 K, −0.65 dex and 0.83 M⊙ for HD 220197; 4941 K, −0.74 dex and 0.69 M⊙ for HD 233832) are lower than the spectroscopic values obtained from HARPS-N. This result has been noted in previous works (e.g. Biazzo et al. 2007; Sozzetti et al. 2007; Torres et al. 2012; Tsantaki et al. 2013; Maldonado et al. 2015b).
We synthesized the spectral lines around 6200 and 6700 Å to obtain an estimate of projected rotational velocity v sin i from fixed macroturbulence, instrument resolution, and limb-darkening coefficient, using the atmospheric models of Kurucz (1993). For HD 220197, assuming from the relations found in Brewer et al. (2016) vmacro = 3.1 km s−1, we find a projected rotational velocity of vsini = 1.5 ± 0.5 km s−1, while for the cooler HD 233832, we assume from the same relations vmacro = 1.8 km s−1 and obtain a projected rotational velocity of 0.8 ± 0.5 km s−1, which is below the ~2 km s−1 resolution ofHARPS-N and suggests a very slow stellar rotation unless the star is observed nearly pole-on. From these estimates of v sin i, we can give upper limits for the rotational period as Prot = 2πR*∕vsini, obtaining values of 31 days for HD 220197 and 43 days for HD 233832. With the mean values of  of −4.96 for HD 220197 and −5.01 for HD 233832 (see Sect. 4 and Fig. 2) from our observations, we can also provide analytical estimates of the rotation period Prot using the empirical relations from Noyes et al. (1984) and Mamajek & Hillenbrand (2008). We obtain values of ~ 19 and ~41 days for HD 220197 and HD 233832, respectively.
We also note that the Second Data Release (DR2) of the astrometric satellite Gaia (see Gaia Collaboration 2016; Brown et al. 2018) has confirmed the existence of a cooler (Teff =  K) and fainter (G = 12.71 mag) stellar companion for HD 233832 at comparable parallax of 17.066 ± 0.053 mas and at 4.8 arcsec of angular separation, which at a distance of 59 pc (see Table 1 for the parallax value of the star) implies a projected separation of 280 AU. This stellar object was listed as a possible companion for HD 233832 in previous catalogues (e.g. Cutri et al. 2003), but in the absence of parallax measurements, its was not possible to confirm its binarity nature before the release of Gaia DR2 astrometry measurements. Assuming a metallicity value similar to that of the primary star, we used the Yonsei-Yale isochrones to provide a first estimate of mass and radius for this companion star of 0.420 ± 0.049 M⊙ and 0.367 ± 0.026 R⊙. With this estimate of the mass and orbital projected separation of both stellar components, we can give a first assessment of the order of magnitude of the stellar companion’s orbital period as PB ~4400 yr.
The results on elemental abundances allow us to investigate to which population the two targets belong. We thus considered the abundances of field stars listed in the catalogues by Soubiran & Girard (2005) and Adibekyan et al. (2012c) and applied the prescriptions reported in Biazzo et al. (2015). We thus used as abundance of α-elements the abundances obtained from magnesium, silicon, calcium, and titanium. Figure 3 shows the position of HD 220197 and HD 233832 in the [α/Fe] versus [Fe/H] diagram. Based on these chemical indicators, the star HD 220197 is more likely to be a thick-disc star than HD 233832. The latter lies in a metallicity region that is populated by both thin- and thick-disc stars.
Another way to classify the two stars as either thin- or thick-disc objects is to use statistical indicators that are purely based on kinematics, which can then be compared with our inference based on the chemical indicator [α/Fe]. In order to calculate the likelihood of any given object of belonging to either of the two populations on the basis of its Galactic kinematics, a number of approaches can be adopted. We elected to carry out population assignments using the classifications by Bensby et al. (2003, 2005). First, we combined systemic radial velocity and Gaia DR2 proper motion and parallax for both stars to calculate the Galactic velocity vector (U, V, W, with U positive toward the Galactic anticentre) with respect to the local standard of rest (LSR), adjusting for the standard solar motion (U⊙, V⊙, W⊙) = (− 8.5, 13.38, + 6.49) km s−1 (following Coskunoǧlu et al. 2012). Then, we calculated the thick-to-thin disc probability ratio TD∕D using the prescriptions of Bensby et al. (2003, 2005) for the velocity dispersion and asymmetric drift of the assumed Gaussian velocity ellipsoid for the two populations, and the observed fractions of each population in the solar neighbourhood (4 and 96%, respectively). Bensby et al. (2003) suggested as threshold to clearly identify thick- and thin-disc stars values of TD∕D ≥ 10 and TD∕D ≤ 0.1, respectively. We find for HD 233832 and HD 220197 TD∕D = 1113 and TD∕D = 2.8, respectively, which means that HD 233832 is rather clearly a thick-disc object, while for HD 220197 the evidence points to an object whose kinematics are intermediate between that of thin and thick disc. With the results from the two methods, we can therefore reasonably classify both HD 220197 and HD 223832 as thick-disc object within the uncertainties of the disc populations.
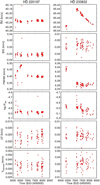 |
Fig. 2 Time series of measurements obtained with HARPS-N on HD 220197 (left column) and HD 233832 (right column). The rows from top to bottom show radial velocities, the bisector inverse span, the CCF FWHM, |

Newly derived stellar parameters and elemental abundances.
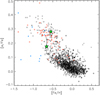 |
Fig. 3 [α/Fe] vs. [Fe/H] for HD 220197 (upper star) and HD 233832 (lower star). Thin-disc, thick-disc, and halo stars are shown with circles, squares, and asterisks, respectively (filled symbols: Soubiran & Girard 2005; open symbols: Adibekyan et al. 2012c). |
4 Radial velocity analysis
After finding significant peaks in the radial velocity periodograms for stars HD 220197 and HD 233832, we searched for a single-planet orbital solution through a differential evolution Markov chain Monte Carlo method (Eastman et al. 2013; Desidera et al. 2014). The nine free parameters were inferior conjuction epoch Tc, orbital period P,  ,
,  , semi-amplitude K, and a zero-point radial velocity γ and an uncorrelated jitter term j for each instrument (Keck and HARPS-N). Uninformative priors were used for all parameters. Eighteen chains were run simultaneously and reached convergence and good mixing according to the criteria established in Eastman et al. (2013).
To ensure that the detected signals are not of stellar origin, we searched for correlations betweeen radial velocities and activity index bisector inverse spans (BIS), the FWHM of the CCF,  , ΔV, and Vasy(mod). To obtain values of BIS, FWHM, ΔV, and Vasy(mod) from our HARPS-N spectra, we used the IDL procedure presented in Lanza et al. (2018), while
  was obtained as detailed in Lovis et al. (2011). The fitted and derived parameters and their 1σ uncertainties, taken as the medians of the posterior distributions and their 34.13% intervals, are listed in Table 4 and are discussed in the following paragraphs.
Orbital fit results.
HARPS-N measurements for HD 220197 and HD 233832.
HD 220197
We observed this star with HARPS-N from August 2012 to October 2017, obtaining 88 measurements with a mean S/N of ~110 that we joined with the five Keck datapoints from Sozzetti et al. (2009). We note that the seven HARPS-N spectra obtained between epochs 2456166.69 and 2456201.60 were taken with only the spectral orders falling on the blue side of the CCD. From these datapoints, we excluded the point taken at epoch 2456181.62 because of its low S/N and the point taken at epoch 2456602.56, which showshighly discrepant values in radial velocity, BIS, and FWHM compared to the mean values of the time series (see Fig. 2 and Table 5). This suggests that this particular observation is affected by an instrumental effect that we are not able to completely correct for.
The periodogram of the time series (see top panel of Fig. 5) shows a highly significant peak at ~1720 days with an FAP of 0.01% as calculated via bootstrap method, which appears to be uncorrelated with any of the activity indexes analysed (see bottom panels of Fig. 5) and therefore not of clear stellar origin. The data are best fit by a Keplerian curve (see Fig. 4 and first column of Table 4) with a semi-amplitude K =  m s−1, period P =
  days, and eccentricity e =
  , from which we obtain a planetary minimum mass of
  MJup and a semi-major axis of
  AU.
AU.
To account for any offset or inconsistency between the half-chip and full-chip data, we also searched for an orbital solution by treating the two groups of data as independent datasets and allowing for an offset between them. The resulting solution features a Bayesian information criterion value (BIC) of 326.62, similar to the BIC value of 321.69 obtained for the solution lacking any distinction between full-chip and half-chip data shown in Fig. 4 and Table 4. The introduction of an offset between half-chip and full-chip data is not clearly statistically preferred, and we therefore find no compelling reason to treat them as independent datasets. A similar case has been represented by Desidera et al. (2013), in which the inclusion or lack of an offset between half-chip and full-chip data collected with HARPS-N also turned out to be non-significant in the analysis of the radial velocity data of the metal-poor star HIP 11952.
While a low-power peak can be found in both FWHM and  periodograms (see fourth and fifth panels of Fig. 5) near the proposed orbital period for HD 220197 b, we stress that these two are non-significant peaks. Their FAP is 100 and 99.4%, respectively.
The post-fit residual data show a maximum peak around a period of ~17 days, near our expected stellar rotation period of 19 days (see Sect. 3), and another peak of comparable power at ~80 days; both peaks have an associated FAP of 55% and are therefore non-significant (see second panel of Fig. 5).
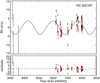 |
Fig. 4 Orbital fit for the planet HD 220197 b. Top panel: our best-fit solution in shown as a black curve over the literature datapoints from Keck (green) and our HARPS-N observations (blue for half-chip data, red for full-chip data). Bottom panel: residual radial velocities. |
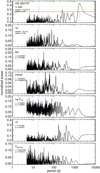 |
Fig. 5 Activity index periodograms for the star HD 220197. Two top panels: periodograms for the radial velocity data and post-fit residuals; the most significant period value and power are shown in the upper right corner, while the horizontal lines indicate the FAP levels of 10% (solid red), 1% (dashed orange), and 0.1%(dotted green). Following lower panels: periodograms for the bisector inverse span, FWHM, |

HD 233832
We monitored this star with HARPS-N from February 2013 to May 2018, obtaining 80 HARPS-N measurements with a mean S/N of ~74. An additional five Keck datapoints were collected from Sozzetti et al. (2009).
The HARPS-N data clearly show a ~80 m s−1 variation in radial velocities, although we note that our observations failed to satisfactorily sample the minimum and rising portions of this variation. It may be argued that such a variation in radial velocity could be related to the stellar companion recently confirmed by Gaia at angular separation of 4.8 arcsec and for which we provide a first estimate of MB = 0.420 ± 0.049 M⊙ and RB = 0.367 ± 0.026 R⊙ (see Sect. 3). We propose, however, that this is not the case: following the example set in Torres (1999), we can estimate the acceleration d(RV)∕dt caused by the stellar companion on the primary as
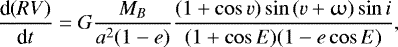 (1)
(1)
where a = aA(MA + MB)∕MB is the semi-major axis of the relative orbit, v is the true anomaly, i is the mutual inclination, and E is the eccentric anomaly. Without an estimate of the orbital elements of the companion star except for the projected separation ~280 AU, we generated 105 possible combinations of orbital elements (e, v, ω, E, i), from which we obtain a mean acceleration of 0.39 m s−1yr−1. In addition to this, we estimate the maximum acceleration for a circular, edge-on stellar orbit to be 0.14 m s−1yr−1. Both values, we note, are exceptionally low and would cause a variation of at most ~5.82 m s−1 over our 15-yr baseline. We therefore argue that the origin of the observed ~80 m s−1 variation in the radial velocities of HD 233832 is not the gravitational influence of its long-period stellar companion.
The radial velocity periodogram (see top panel of Fig. 7) shows a region of significant power between 1000 and 6000 days, peaking around 1920 days with an FAP of 0.01%. The MCMC we launched with uniform priors returned a Keplerian best-fit with orbital period P =  days showing a large upper error bar; this solution also has a period posterior distribution featuring two peaks of comparable likelihood around P ~ 2000 d and P ~ 4000 d. To try and solve this apparent degeneracy in period, we fit again the data by setting Gaussian priors on the orbital period centred on 2000 and 4000 days with a width of 500 days in order to determine which period is statistically favoured. A comparison between the results of these fits is shown in Fig. 6 and Table 4.
We thus find two solutions that are mainly distinguished by their values in semi-amplitude, period, and minimum planetary mass. Choosing a prior centred around 2000 days returns a Keplerian solution with K =  m s−1, P =
  days, and M
 MJup, while the prior around 4000 days returns a solution with K =
  m s−1, P =
  days, and M
 MJup. It is clear by comparing the BIC value for each solution (of 355.02 and 357.16, respectively) that none is strongly preferred above the other, although the P ~2000 days solution is formally preferred for having a slightly lower BIC value; no solid conclusion on the value of the planet’s orbital period is therefore possible with the available data.
While the presence of the giant planet is clear, the values of its orbital period and mass remain ambiguous, and more data with better sampling of the radial velocity minimum and its rise to maximum are needed to distinguish between thetwo solutions. Another way to resolve this ambiguity may come from observations with the astrometric satellite Gaia, which by the end of its five-year mission will have observed a significant portion of both proposed orbits. We can calculate the astrometric signatures produced on the host star by these two possible solutions as
 (2)
(2)
where α is in arcseconds, if planetary and stellar mass are given in solar mass units, semi-major axis a in AU, and stellar distance d in parsec. We then find α ~ 115 μas for the P ~ 2000 days solution and α ~ 278 μas for the P ~ 4000 days solution. Both are expected to be detected at high S/N by Gaia for a star this bright (G = 9.899 mag).
The periodograms on residual data for the two different orbital solutions (see the second and third panels of Fig. 7) show major peaks at around 13 days for the P ~ 2000 days solution and around 10 days for the P ~ 4000 days solution with an associated FAP of 27 and 52%, respectively, and therefore are both non-significant.
We also find in the periodogram of the activity index  a clue for an uncorrelated long-period activity trend in the same period range as our proposed planetary solutions (see sixth panel of Fig. 7). While the blending of the target star spectra with a nearby star can produce similar effects in the activity indexes (see Santos et al. 2002), the known star nearest to HD 233832 is its companion confirmed by Gaia observations at 4.8 arcsec, an angular distance much higher than the 1 arcsec aperture on the sky of HARPS-N fibers and therefore unlikely to cause such an effect. While it may also be argued that such an activity trend may in fact produce the observed radial velocity variation of HD 233832 and therefore mimic the presence of a massive planet, it is worthy of note that most cases of activity-induced radial velocity signals mimicking giant planets have semi-amplitudes of 10 m s−1 or lower (see Carolo et al. 2014; Endl et al. 2016; Johnson et al. 2016, for recent examples), much lower than the ~40 m s−1 semi-amplitude observed in our HARPS-N data. The 11-yr activity cycle of the Sun itself produces a radial velocity variation of 4.98 ± 1.44 m s−1, as detailed in Lanza et al. (2016). Furthermore, the analysis of 304 FGK stars reported in Lovis et al. (2011) and conducted with HARPS concluded that while 61% of old solar-type stars have a detectable activity cycle inducing long-period radial velocity signals, the semi-amplitude of the effect is limited in the worst case of their sample to ~11 m s−1, and more typical values are usually lower than 3 m s−1.
To further support this point, we can give an estimate of the radial velocity perturbation caused by different activity effects related to stellar rotation using the relations found in Saar & Donahue (1997), Saar et al. (1998) and Saar & Fischer (2000) between projected rotational velocity v sini, macroturbolent velocity vmacro, and percentage of surface area covered by spot distribution inhomogeneity fs (ranging from zero for old, inactive stars to several percent for active stars); we also note that Saar et al. (1998) derived that old, slow-rotating stars (v sini ≤ 2 km s−1, Prot ≥ 15 d) generally have very low mean activity-related radial velocity noise ( 4.6 m s−1). From spectroscopic analyses (see Sect. 3 and Table 3) we have found for HD 233832 a projected velocity of v sini = 0.8 km s−1 assuming vmacro = 1.8 km s−1. When we use, as suggested in Saar & Donahue (1997), the relation fs ~ 0.4 Δy, where the Strömgren index is Δy = 0.518 ± 0.008 mag for HD 233832 (see Mints & Hekker 2017), we obtain fs ~ 0.21%. We therefore find a spot-related perturbation As = 1.26 m s−1, a bisector velocity span variation Ac = 0.013 m s−1, and a weighted velocity dispersion
  m s−1. This is all well below our observed ~80 m s−1 variation.
To also account for radial velocity variations induced by long-term magnetic activity cycles (see Santos et al. 2010b; Lovis et al. 2011; Dumusque et al. 2011) that may mimic the presence of a long-period giant planet, we instead used the empirical models found in Lovis et al. (2011), which provide a relationship between effective temperature, metallicity, and the measured  semi-amplitude. The latter being 0.055 for our observations of HD 233832 (see bottom right panel of Fig. 2), we then find an estimate of the radial velocity semi-amplitude induced by the stellar magnetic activity cycle of ARV ~ 0.30 m s−1, which is also much lower than the observed radial velocity variation of HD 233832.
While caution is certainly needed in announcing the existence of exoplanets, we propose that the signals found in the radial velocity time series of stars HD 220197 and HD 233832 are best explained by the existence of the giant planets we described in the previous paragraphs. Because of its low semi-amplitude of ~4 m s−1, the signal found in the data collected for star HD 220197 would clearly benefit from further observation and analysis. However, we find this signal to be uncorrelated with any significant stellar activity indexes, and a planetary origin remains the most likely explanation based on our analysis. When we instead consider HD 233832, while we cannot completely rule out the presence of a magnetic activity cycle at about either 2000 or 4000 days, we argue that a planetary origin for the radial velocity signal observed for HD 233832 seems to be more likely than a signal exclusively induced by stellar activity since the amplitudes of activity-induced radial velocity variations are proven to be much lower than the one we observe. The possibility of a long-term activity cycle for the star HD 233832 with a period similar to the orbital period of planet b still remains. This situation is similar to the ~11-yr period of Jupiter and the magnetic cycle of the Sun in the solar system and deserves future investigation.
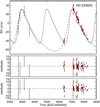 |
Fig. 6 Same as Fig. 4, but for the planet HD 233832 b. Literature Keck datapoints are shown in green and our HARPS-N data are plotted in red. Top panel: solid black curve shows the solution obtained setting a prior on orbital period centred on 2000 days, while the dashed curve is derived from an orbital prior centred around 4000 days. Middle and bottom panels: residuals from the 2000-day and 4000-day solutions, respectively. |
5 Planetary frequency
Joining the two detections in our 42-star northern sample with the three detections and one candidate in the 88-star southern sample analysed in Santos et al. (2007, 2010a, 2011), we obtain a total of five detected giant planets (HD 171028 b, HD 181720 b, HD 190984 b, HD 220197 b and HD 233832 b) and one candidate (around HD 107094) in 130 metal-poor stars. In Fig. 8 the metallicity distribution of the overall sample is shown (values from Santos et al. 2011 for the southern sample and from Sozzetti et al. 2009 for the northern sample), and it can be noted that all detected planets are found in stars at the metal-rich end of the sample. The same applies to the candidate around HD 107094 with a stellar [Fe/H] = −0.51 dex. We also note that the planets HD 220197 b and HD 233832 b presented in this work orbit stars with the lowest metallicity around which detected planets are found in the combined HARPS+HARPS-N sample.
While an accurate estimate of the frequency fp of giant planets around metal-poor stars would require an assessment of the survey detection limits and will be the subject of a future paper, we can preliminarily note that the five detected planets all have a high radial velocity semi-amplitude, ranging from the K ~ 4 m s−1 signal of HD220197 b to the K ~ 60 m s−1 signal of HD 171028 b. The same also applies to the proposed K ~ 88 m s−1 planetary signal for the star HD 107094 (see Santos et al. 2011). The orbital periods are also long, ranging from the P ~ 550 days of HD 171028 b to the P ~ 4885 days of HD 190984 b. We can therefore assume that such combinations of high-value semi-amplitude and periods would be detectable 100% of the times with the high-precision of HARPS and HARPS-N, with the possible exception of HD 220197 b having the lowest K of all detected signals.
We can therefore provide a preliminary estimate of the occurrence frequency of giant planets in our metal-poor sample fp using the binomial distribution:
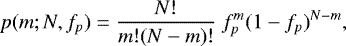 (3)
(3)
being N = 130 our whole two-hemisphere sample assuming a detection completeness for the semi-amplitudes and periods of our planetary signals and m the number of detections in the sample. By considering only the five detected giant planets, we thus obtain a frequency of  , while by also including the candidate signal found for star HD 107094, we have m = 6 and a frequency
  , the uncertainty in both values being the 1σ error bar. We note that both frequency values are compatible and slightly better constrained than the
  value obtained by Santos et al. (2011) for their three detections in the 88-star southern sample.
We stress that the detected planets all lie at the metal-rich end of the two-hemisphere sample, ranging from [Fe/H] approximately −0.7 to −0.4 dex. When we only consider the 67 stars in this metallicity range, we obtain a frequency of  , which is comparable with the ~5% estimate for [Fe/H] ~ 0 dex obtained by Mortier et al. (2012, 2013), and Gonzalez (2014). When we instead consider the 63 stars at the metal-poor end of the sample ([Fe/H] < − 0.7 dex) in which no giant planets were found in the two-hemisphere sample, we obtain an upper limit on frequency of fP < 1.76%, which is significantly lower than the other values obtained by our analysis, again showing fp to be a rising function of [Fe/H] even at these low metallicity values.
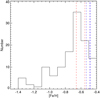 |
Fig. 8 Metallicity distribution for the 130 metal-poor stars, distributed in the two hemispheres. The metallicities of stars HD 220197 and HD 233832 are indicated by the vertical dashed red lines, while the metallicities of southern host stars HD 171028, HD 181720 and 190984 are shown as blue dashed lines (see Santos et al. 2011). |
6 Summary and discussion
We reportedthe detection of the two long-period giant planets HD 220197 b and HD 233832 b as a result of the intense observation of 42 metal-poor stars with HARPS-N conducted as a complement to the study of the southern metal-poor sample previously detailed in Santos et al. (2007, 2010a, 2011) and to continue the analysis of the correlation between stellar metallicity and giant planet frequency (Gonzalez 1997; Sozzetti 2004; Sozzetti et al. 2009; Mortier et al. 2012; Santos et al. 2011). This correlation is usually proposed as strong evidence in favour of core-accretion formation for giant planets over disc instability processes.
We have characterized in Sect. 3 the host stars as α-enriched stars that are likely members of the thick-disc stellar population; this agrees with previous studies (Adibekyan et al. 2012a,b) that found that metal-poor host stars tend to have a significant overabundance of α-elements and are part of the thick-disc population compared to non-hosting stars. In addition, Maldonado et al. (2018) also noted that stars hosting cool Jupiters like HD 220197 b and HD 233832 b also have higher α abundances than stars hosting hot Jupiters, suggesting that the low [Fe/H] content in such protoplanetary discs may be compensated for by this overabundance of α-elements to allow the formation of planetary cores.
We find HD 220197 b to be characterised as an M MJup orbiting its host star with a period of
  days. Although it could be noted that this low-amplitude signal (K =
  m s−1) should be treated with caution, we find that given the results of the current analysis, the planetary nature of the signal remains the most likely explanation. We note that this planet is the least massive long-period (P > 1 yr) giant planet found around such a metal-poor star, an interesting counter-example to the tendency of metal-poor stars to host more massive planets (e.g. Santos et al. 2017).
On the other hand, the orbital characteristics of HD 233832 are more ambiguous. We find two solutions of equal statistical weight at P =  days and P =
  , which returns possible minimum masses of
  MJup and
  MJup. Clearly, more radial velocity data are required to provide a better sampling of its Doppler variation to distinguish between the two competing solutions. Since the analysis of stellar activity is always an important part in searching for planetary signals, we handled the signal found for HD 233832 with particular care because of the long-period activity signal in the periodogram of activity index
  near our proposed orbital solutions. Following the analysis of activity-induced radial velocity signals of Saar & Donahue (1997); Saar et al. (1998); Saar & Fischer (2000); Santos et al. (2010b); Lovis et al. (2011); Dumusque et al. (2011), we argue, however, that such activity signals would be at most on the order of 5 m s−1, well below the ~80 m s−1 variation observed for HD 233832, suggesting a planetary origin for the radial velocity signal. The same applies to the influence of the stellar companion at an angular separation of 4.8 arcsec that has recently been detected by Gaia. We cannot completely rule out a low-amplitude activity cycle with period similar to our solutions for HD 233832 b, similarly to what is found in the solar system for the orbital period of Jupiter and the magnetic activity cycle of the Sun. More analyses are therefore required to fully characterise this interesting planetary system.
Joining our detections with the three giant planets (HD 171028 b, HD 181720 b and HD 190984 b) detected in the HARPS metal-poor sample (see Santos et al. 2011), we obtain a total of five detections in 130 metal-poor stars. In a preliminary statistical analysis, assuming survey completeness for the high-value radial velocity semi-amplitudes (4–60 m s−1) and periods (550–4885 days) of the detected planets, we find a frequency of giant planets around metal-poor stars of  %. This value increases to
  % when we also include the candidate planetary signal found in the southern sample around HD 107094 (see Santos et al. 2011). When we instead consider only the 67 stars in the metallicity range (−0.7 < [Fe/H] < −0.4 dex) in which the detected planets are found, the frequency increases to
  . This value is similar to literature estimates on giant planet frequency around solar-metallicity stars (see Mortier et al. 2012, 2013; Gonzalez 2014). We stress that similarly to the case of the Santos et al. (2011) analysis, our frequency results are conservative as we did not account for completeness in the survey, which will be the subject of a future paper.
Interestingly, the host stars lie at the metal-rich end of the overall stellar sample, reinforcing previous results that suggested that the frequency of giant planets continues to be a rising function of stellar metallicity even for metal-poor stars and favouring core-accretion processes for the formation of giant planets (Ida & Lin 2004; Mordasini et al. 2009). This is also reinforced by the fp < 1.76% obtained from the null detections below [Fe/H] < −0.7 dex. We note, however, that our calculation of fp should be seen as a preliminar update of giant planet frequency around metal-poor stars, and that a more rigorous assessment of its value will be the subject of a future paper.
While the correlation between stellar metallicity and occurrence of giant planets continues to be confirmed by observations, more analysis is clearly needed to provide a more solid observational basis from which to shed light on planet formation mechanisms and their relation to host star characteristics.
Acknowledgements
We thank the anonymous referee for the useful comments. The GAPS project acknowledges the support by INAF/Frontiera through the “Progetti Premiali” funding scheme of the Italian Ministry of Education, University, and Research. D.B. acknowledges financial support from INAF and Agenzia Spaziale Italiana (ASI grant no. 014-025-R.1.2015) for the 2016 Ph.D. fellowship programme of INAF. N.C.S. and J.F. acknowledge the support by the Fundação para a Ciência e Tecnologia (FCT) through national funds and by FEDER through COMPETE2020 by grants UID/FIS/04434/2013 & POCI-01-0145-FEDER-007672. This work was also funded by FEDER – Fundo Europeu de Desenvolvimento Regional funds through the COMPETE 2020 – Programa Operacional Competitividade e Internacionalização (POCI), and by Portuguese funds through FCT in the framework of the project POCI-01-0145-FEDER-028953 and POCI-01-0145-FEDER-032113. L.M. acknowledges support from the Italian Minister of Instruction, University and Research (MIUR) through FFABR 2017 fund. L.M. also acknowledges support from the University of Rome Tor Vergata through “Mission: Sustainability 2016” fund. G.S. acknowledges financial support from “Accordo ASI–INAF” No. 2013-016-R.0 July 9, 2013 and July 9, 2015.
References
- Adibekyan, V. Z., Santos, N. C., Sousa, S. G., et al. 2012a, A&A, 543, A89 [NASA ADS] [CrossRef] [EDP Sciences] [Google Scholar]
- Adibekyan, V. Z., Delgado Mena, E., Sousa, S. G., et al. 2012b, A&A, 547, A36 [NASA ADS] [CrossRef] [EDP Sciences] [Google Scholar]
- Adibekyan, V. Z., Sousa, S. G., Santos, N. C., et al. 2012c, A&A, 545, A32 [NASA ADS] [CrossRef] [EDP Sciences] [Google Scholar]
- Benatti, S., Desidera, S., Damasso, M., et al. 2017, A&A, 599, A90 [NASA ADS] [CrossRef] [EDP Sciences] [Google Scholar]
- Bensby, T., Feltzing, S., & Lundström, I. 2003, A&A, 410, 527 [NASA ADS] [CrossRef] [EDP Sciences] [Google Scholar]
- Bensby, T., Feltzing, S., Lundström, I., & Ilyin, I. 2005, A&A, 433, 185 [NASA ADS] [CrossRef] [EDP Sciences] [Google Scholar]
- Biazzo, K., Pasquini, L., Girardi, L., et al. 2007, A&A, 475, 981 [NASA ADS] [CrossRef] [EDP Sciences] [Google Scholar]
- Biazzo, K., Gratton, R., Desidera, S., et al. 2015, A&A, 583, A135 [NASA ADS] [CrossRef] [EDP Sciences] [Google Scholar]
- Bonfils, X., Delfosse, X., Udry, S., et al. 2013, A&A, 549, A109 [NASA ADS] [CrossRef] [EDP Sciences] [Google Scholar]
- Boss, A. P. 1997, Science, 276, 1836 [NASA ADS] [CrossRef] [Google Scholar]
- Boss, A. P. 2002, ApJ, 576, 462 [NASA ADS] [CrossRef] [Google Scholar]
- Boss, A. P. 2006, ApJ, 644, L79 [NASA ADS] [CrossRef] [Google Scholar]
- Brewer, J. M., Fischer, D. A., Valenti, J. A., & Piskunov, N. 2016, ApJS, 225, 32 [NASA ADS] [CrossRef] [Google Scholar]
- Brown, A. G. A., Vallenari, A., Prusti, T., et al. 2018, A&A, 616, A1 [NASA ADS] [CrossRef] [EDP Sciences] [Google Scholar]
- Buchhave, L. A., Latham, D. W., Johansen, A., et al. 2012, Nature, 486, 375 [NASA ADS] [Google Scholar]
- Buchhave, L. A., Bitsch, B., Johansen, A., et al. 2018, ApJ, 856, 37 [NASA ADS] [CrossRef] [Google Scholar]
- Butler, R. P., Vogt, S. S., Marcy, G. W., et al. 2004, ApJ, 617, 580 [NASA ADS] [CrossRef] [Google Scholar]
- Carney, B. W., Laird, J. B., Latham, D. W., & Aguilar, L. A. 1996, AJ, 112, 668 [NASA ADS] [CrossRef] [Google Scholar]
- Carolo, E., Desidera, S., Gratton, R., et al. 2014, A&A, 567, A48 [NASA ADS] [CrossRef] [EDP Sciences] [Google Scholar]
- Cosentino, R., Lovis, C., Pepe, F., et al. 2012, in Ground-Based and Airborne Instrumentation for Astronomy IV, Proc. SPIE, 8446, 84461V [Google Scholar]
- Coskunoǧlu, B., Ak, S., Bilir, S., et al. 2012, MNRAS, 419, 2844 [NASA ADS] [CrossRef] [Google Scholar]
- Courcol, B., Bouchy, F., & Deleuil, M. 2016, MNRAS, 461, 1841 [NASA ADS] [CrossRef] [Google Scholar]
- Covino, E., Esposito, M., Barbieri, M., et al. 2013, A&A, 554, A28 [NASA ADS] [CrossRef] [EDP Sciences] [Google Scholar]
- Cutri, R. M., Skrutskie, M. F., van Dyk, S., et al. 2003, VizieR Online Data Catalog: II/246 [Google Scholar]
- Damasso, M., Biazzo, K., Bonomo, A. S., et al. 2015, A&A, 575, A111 [NASA ADS] [CrossRef] [EDP Sciences] [Google Scholar]
- da Silva, L., Girardi, L., Pasquini, L., et al. 2006, A&A, 458, 609 [NASA ADS] [CrossRef] [EDP Sciences] [Google Scholar]
- Desidera, S., Sozzetti, A., Bonomo, A. S., et al. 2013, A&A, 554, A29 [NASA ADS] [CrossRef] [EDP Sciences] [Google Scholar]
- Desidera, S., Bonomo, A. S., Claudi, R. U., et al. 2014, A&A, 567, L6 [NASA ADS] [CrossRef] [EDP Sciences] [Google Scholar]
- Dumusque, X., Lovis, C., Ségransan, D., et al. 2011, A&A, 535, A55 [NASA ADS] [CrossRef] [EDP Sciences] [Google Scholar]
- Eastman, J., Gaudi, B. S., & Agol, E. 2013, PASP, 125, 83 [NASA ADS] [CrossRef] [Google Scholar]
- Endl, M., Brugamyer, E. J., Cochran, W. D., et al. 2016, ApJ, 818, 34 [NASA ADS] [CrossRef] [Google Scholar]
- Figueira, P., Santos, N. C., Pepe, F., Lovis, C., & Nardetto, N. 2013, A&A, 557, A93 [NASA ADS] [CrossRef] [EDP Sciences] [Google Scholar]
- Figueira, P., Santos, N. C., Pepe, F., Lovis, C., & Nardetto, N. 2015, A&A, 582, C2 [CrossRef] [EDP Sciences] [Google Scholar]
- Fischer, D. A., & Valenti, J. 2005, ApJ, 622, 1102 [NASA ADS] [CrossRef] [Google Scholar]
- Gaia Collaboration (Prusti, T., et al.) 2016, A&A, 595, A1 [NASA ADS] [CrossRef] [EDP Sciences] [Google Scholar]
- Gonzalez, G. 1997, MNRAS, 285, 403 [NASA ADS] [CrossRef] [Google Scholar]
- Gonzalez, G. 2014, MNRAS, 443, 393 [NASA ADS] [CrossRef] [Google Scholar]
- Haywood, M. 2008, A&A, 482, 673 [NASA ADS] [CrossRef] [EDP Sciences] [Google Scholar]
- Haywood, M. 2009, ApJ, 698, L1 [NASA ADS] [CrossRef] [Google Scholar]
- Ida, S., & Lin, D. N. C. 2004, ApJ, 616, 567 [NASA ADS] [CrossRef] [MathSciNet] [Google Scholar]
- Johnson, J. L., & Li, H. 2012, ApJ, 751, 81 [NASA ADS] [CrossRef] [Google Scholar]
- Johnson, J. A., Butler, R. P., Marcy, G. W., et al. 2007, ApJ, 670, 833 [NASA ADS] [CrossRef] [Google Scholar]
- Johnson, J. A., Aller, K. M., Howard, A. W., & Crepp, J. R. 2010, PASP, 122, 905 [NASA ADS] [CrossRef] [Google Scholar]
- Johnson, M. C., Endl, M., Cochran, W. D., et al. 2016, ApJ, 821, 74 [NASA ADS] [CrossRef] [Google Scholar]
- Jones, M. I., & Jenkins, J. S. 2014, A&A, 562, A129 [NASA ADS] [CrossRef] [EDP Sciences] [Google Scholar]
- Kang, W., Lee, S.-G., & Kim, K.-M. 2011, ApJ, 736, 87 [NASA ADS] [CrossRef] [Google Scholar]
- Kurucz, R. L. 1993, in IAU Colloquium 138: Peculiar versus Normal Phenomenao in A-type and Related Stars, eds. M. M. Dworetsky, F. Castelli, & R. Faraggiana, ASP Conf. Ser., 44, 87 [NASA ADS] [Google Scholar]
- Lanza, A. F., Molaro, P., Monaco, L., & Haywood, R. D. 2016, A&A, 587, A103 [NASA ADS] [CrossRef] [EDP Sciences] [Google Scholar]
- Lanza, A. F., Malavolta, L., Benatti, S., et al. 2018, A&A, 616, A155 [NASA ADS] [CrossRef] [EDP Sciences] [Google Scholar]
- Lovis, C., Dumusque, X., Santos, N. C., et al. 2011, ArXiv e-prints [arXiv:1107.5325] [Google Scholar]
- Maldonado, J., Eiroa, C., Villaver, E., Montesinos, B., & Mora, A. 2015a, A&A, 579, A20 [NASA ADS] [CrossRef] [EDP Sciences] [Google Scholar]
- Maldonado, J., Affer, L., Micela, G., et al. 2015b, A&A, 577, A132 [NASA ADS] [CrossRef] [EDP Sciences] [Google Scholar]
- Maldonado, J., Villaver, E., & Eiroa, C. 2018, A&A, 612, A93 [NASA ADS] [CrossRef] [EDP Sciences] [Google Scholar]
- Mamajek, E. E., & Hillenbrand, L. A. 2008, ApJ, 687, 1264 [NASA ADS] [CrossRef] [Google Scholar]
- Mayer, L., Quinn, T., Wadsley, J., & Stadel, J. 2002, Science, 298, 1756 [NASA ADS] [CrossRef] [PubMed] [Google Scholar]
- Mayor, M., Pepe, F., Queloz, D., et al. 2003, The Messenger, 114, 20 [NASA ADS] [Google Scholar]
- Mayor, M., Marmier, M., Lovis, C., et al. 2011, ArXiv e-prints [arXiv:1109.2497] [Google Scholar]
- Mints, A., & Hekker, S. 2017, A&A, 604, A108 [NASA ADS] [CrossRef] [EDP Sciences] [Google Scholar]
- Monet, D. G., Levine, S. E., Canzian, B., et al. 2003, AJ, 125, 984 [NASA ADS] [CrossRef] [Google Scholar]
- Mordasini, C., Alibert, Y., & Benz, W. 2009, A&A, 501, 1139 [NASA ADS] [CrossRef] [EDP Sciences] [Google Scholar]
- Mordasini, C., Alibert, Y., Benz, W., Klahr, H., & Henning, T. 2012, A&A, 541, A97 [NASA ADS] [CrossRef] [EDP Sciences] [Google Scholar]
- Mortier, A., Santos, N. C., Sozzetti, A., et al. 2012, A&A, 543, A45 [NASA ADS] [CrossRef] [EDP Sciences] [Google Scholar]
- Mortier, A., Santos, N. C., Sousa, S. G., et al. 2013, A&A, 557, A70 [NASA ADS] [CrossRef] [EDP Sciences] [Google Scholar]
- Mulders, G. D., Pascucci, I., Apai, D., Frasca, A., & Molenda-Żakowicz, J. 2016, AJ, 152, 187 [NASA ADS] [CrossRef] [Google Scholar]
- Müller, A., Roccatagliata, V., Henning, T., et al. 2013, A&A, 556, A3 [NASA ADS] [CrossRef] [EDP Sciences] [Google Scholar]
- Nardetto, N., Mourard, D., Kervella, P., et al. 2006, A&A, 453, 309 [NASA ADS] [CrossRef] [EDP Sciences] [Google Scholar]
- Noyes, R. W., Hartmann, L. W., Baliunas, S. L., Duncan, D. K., & Vaughan, A. H. 1984, ApJ, 279, 763 [NASA ADS] [CrossRef] [Google Scholar]
- Pollack, J. B., Hubickyj, O., Bodenheimer, P., et al. 1996, Icarus, 124, 62 [NASA ADS] [CrossRef] [Google Scholar]
- Robertson, P., Endl, M., Cochran, W. D., et al. 2012, ApJ, 749, 39 [NASA ADS] [CrossRef] [Google Scholar]
- Ryan, S. G. 1989, AJ, 98, 1693 [NASA ADS] [CrossRef] [Google Scholar]
- Ryan, S. G., & Norris, J. E. 1991, AJ, 101, 1835 [NASA ADS] [CrossRef] [Google Scholar]
- Saar, S. H., & Donahue, R. A. 1997, ApJ, 485, 319 [NASA ADS] [CrossRef] [Google Scholar]
- Saar, S. H., & Fischer, D. 2000, ApJ, 534, L105 [NASA ADS] [CrossRef] [PubMed] [Google Scholar]
- Saar, S. H., Butler, R. P., & Marcy, G. W. 1998, ApJ, 498, L153 [Google Scholar]
- Santos, N. C., Israelian, G., & Mayor, M. 2001, A&A, 373, 1019 [NASA ADS] [CrossRef] [EDP Sciences] [Google Scholar]
- Santos, N. C., Mayor, M., Naef, D., et al. 2002, A&A, 392, 215 [NASA ADS] [CrossRef] [EDP Sciences] [Google Scholar]
- Santos, N. C., Israelian, G., & Mayor, M. 2004, A&A, 415, 1153 [NASA ADS] [CrossRef] [EDP Sciences] [Google Scholar]
- Santos, N. C., Mayor, M., Bouchy, F., et al. 2007, A&A, 474, 647 [NASA ADS] [CrossRef] [EDP Sciences] [Google Scholar]
- Santos, N. C., Mayor, M., Benz, W., et al. 2010a, A&A, 512, A47 [NASA ADS] [CrossRef] [EDP Sciences] [Google Scholar]
- Santos, N. C., Gomes da Silva, J., Lovis, C., & Melo, C. 2010b, A&A, 511, A54 [NASA ADS] [CrossRef] [EDP Sciences] [Google Scholar]
- Santos, N. C., Mayor, M., Bonfils, X., et al. 2011, A&A, 526, A112 [NASA ADS] [CrossRef] [EDP Sciences] [Google Scholar]
- Santos, N. C., Sousa, S. G., Mortier, A., et al. 2013, A&A, 556, A150 [NASA ADS] [CrossRef] [EDP Sciences] [Google Scholar]
- Santos, N. C., Adibekyan, V., Figueira, P., et al. 2017, A&A, 603, A30 [NASA ADS] [CrossRef] [EDP Sciences] [Google Scholar]
- Smart, R. L., & Nicastro, L. 2014, A&A, 570, A87 [NASA ADS] [CrossRef] [EDP Sciences] [Google Scholar]
- Sneden, C. 1973, ApJ, 184, 839 [NASA ADS] [CrossRef] [Google Scholar]
- Soubiran, C., & Girard, P. 2005, A&A, 438, 139 [NASA ADS] [CrossRef] [EDP Sciences] [Google Scholar]
- Sousa, S. G., Santos, N. C., Mayor, M., et al. 2008, A&A, 487, 373 [NASA ADS] [CrossRef] [EDP Sciences] [MathSciNet] [Google Scholar]
- Sousa, S. G., Santos, N. C., Israelian, G., Mayor, M., & Udry, S. 2011, A&A, 533, A141 [Google Scholar]
- Sousa, S. G., Santos, N. C., Adibekyan, V., Delgado-Mena, E., & Israelian, G. 2015, A&A, 577, A67 [NASA ADS] [CrossRef] [EDP Sciences] [Google Scholar]
- Sozzetti, A. 2004, MNRAS, 354, 1194 [CrossRef] [Google Scholar]
- Sozzetti, A., Torres, G., Latham, D. W., et al. 2006, ApJ, 649, 428 [NASA ADS] [CrossRef] [Google Scholar]
- Sozzetti, A., Torres, G., Charbonneau, D., et al. 2007, ApJ, 664, 1190 [NASA ADS] [CrossRef] [Google Scholar]
- Sozzetti, A., Torres, G., Latham, D. W., et al. 2009, ApJ, 697, 544 [NASA ADS] [CrossRef] [Google Scholar]
- Tody, D. 1993, in Astronomical Data Analysis Software and Systems II, eds. R. J. Hanisch, R. J. V. Brissenden, & J. Barnes, ASP Conf. Ser., 52, 173 [NASA ADS] [Google Scholar]
- Torres, G. 1999, PASP, 111, 169 [NASA ADS] [CrossRef] [Google Scholar]
- Torres, G., Fischer, D. A., Sozzetti, A., et al. 2012, ApJ, 757, 161 [NASA ADS] [CrossRef] [Google Scholar]
- Tsantaki, M., Sousa, S. G., Adibekyan, V. Z., et al. 2013, A&A, 555, A150 [NASA ADS] [CrossRef] [EDP Sciences] [Google Scholar]
- Udry, S., Mayor, M., Benz, W., et al. 2006, A&A, 447, 361 [NASA ADS] [CrossRef] [EDP Sciences] [Google Scholar]
- Yi, S. K., Kim, Y.-C., Demarque, P., et al. 2008, in The Art of Modeling Stars in the 21st Century, eds. L. Deng, & K. L. Chan, IAU Symp., 252, 413 [NASA ADS] [CrossRef] [Google Scholar]
- Zechmeister, M., & Kürster, M. 2009, A&A, 496, 577 [NASA ADS] [CrossRef] [EDP Sciences] [Google Scholar]
All Tables
All Figures
|
Fig. 1 Metallicity, magnitude, and effective temperature distribution of the HARPS-N metal-poor sample discussed in this work. The values of stars HD 220197 and HD 233832 are indicated by the vertical dashed red lines. |
| In the text | |
|
Fig. 2 Time series of measurements obtained with HARPS-N on HD 220197 (left column) and HD 233832 (right column). The rows from top to bottom show radial velocities, the bisector inverse span, the CCF FWHM, |
| In the text | |
|
Fig. 3 [α/Fe] vs. [Fe/H] for HD 220197 (upper star) and HD 233832 (lower star). Thin-disc, thick-disc, and halo stars are shown with circles, squares, and asterisks, respectively (filled symbols: Soubiran & Girard 2005; open symbols: Adibekyan et al. 2012c). |
| In the text | |
|
Fig. 4 Orbital fit for the planet HD 220197 b. Top panel: our best-fit solution in shown as a black curve over the literature datapoints from Keck (green) and our HARPS-N observations (blue for half-chip data, red for full-chip data). Bottom panel: residual radial velocities. |
| In the text | |
|
Fig. 5 Activity index periodograms for the star HD 220197. Two top panels: periodograms for the radial velocity data and post-fit residuals; the most significant period value and power are shown in the upper right corner, while the horizontal lines indicate the FAP levels of 10% (solid red), 1% (dashed orange), and 0.1%(dotted green). Following lower panels: periodograms for the bisector inverse span, FWHM, |
| In the text | |
|
Fig. 6 Same as Fig. 4, but for the planet HD 233832 b. Literature Keck datapoints are shown in green and our HARPS-N data are plotted in red. Top panel: solid black curve shows the solution obtained setting a prior on orbital period centred on 2000 days, while the dashed curve is derived from an orbital prior centred around 4000 days. Middle and bottom panels: residuals from the 2000-day and 4000-day solutions, respectively. |
| In the text | |
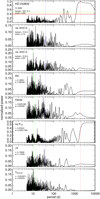 |
Fig. 7 Same as Fig. 5, but for the star HD 233832. |
| In the text | |
|
Fig. 8 Metallicity distribution for the 130 metal-poor stars, distributed in the two hemispheres. The metallicities of stars HD 220197 and HD 233832 are indicated by the vertical dashed red lines, while the metallicities of southern host stars HD 171028, HD 181720 and 190984 are shown as blue dashed lines (see Santos et al. 2011). |
| In the text | |
Current usage metrics show cumulative count of Article Views (full-text article views including HTML views, PDF and ePub downloads, according to the available data) and Abstracts Views on Vision4Press platform.
Data correspond to usage on the plateform after 2015. The current usage metrics is available 48-96 hours after online publication and is updated daily on week days.
Initial download of the metrics may take a while.