Fig. 5
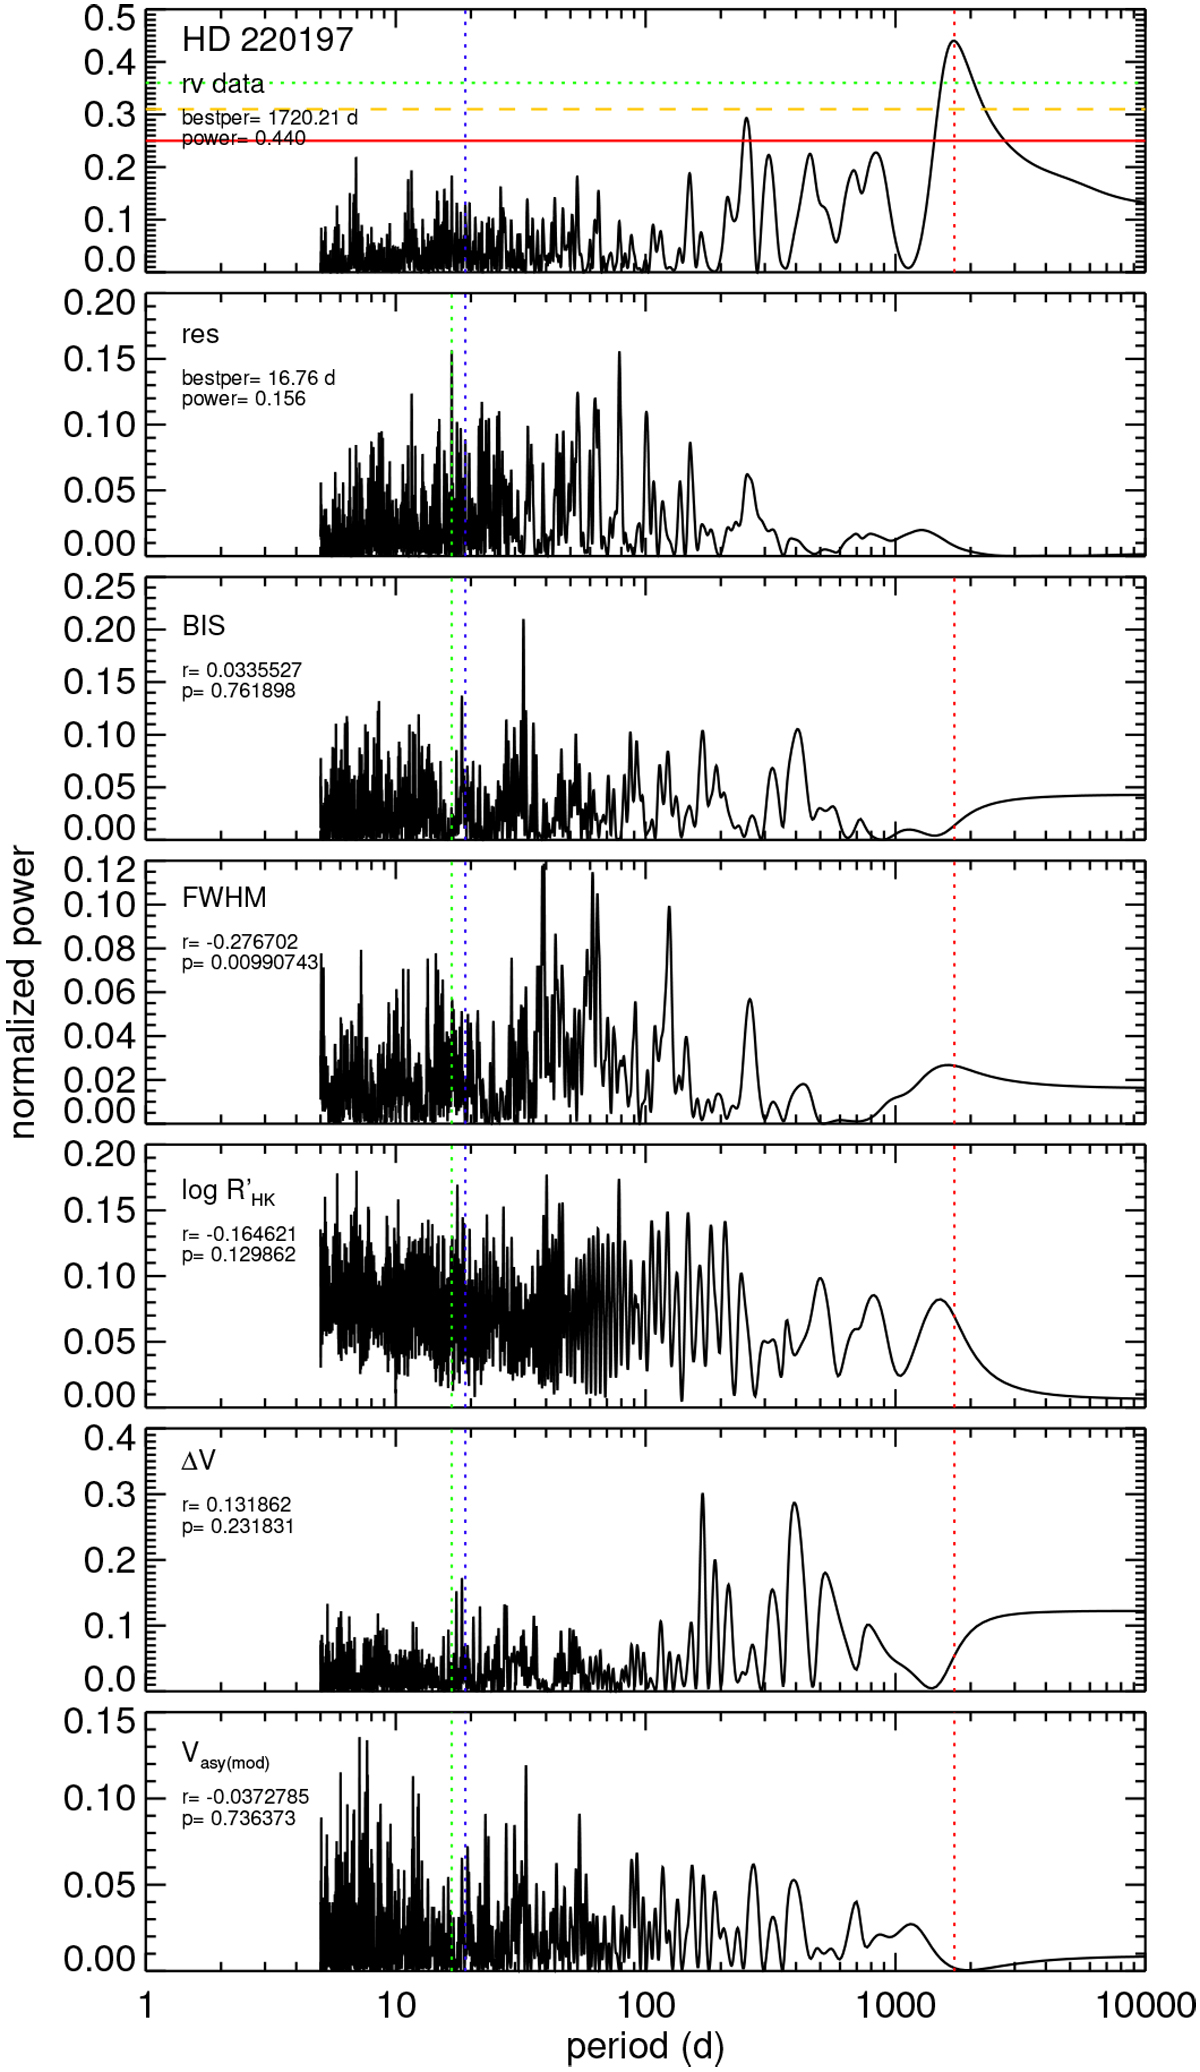
Activity index periodograms for the star HD 220197. Two top panels: periodograms for the radial velocity data and post-fit residuals; the most significant period value and power are shown in the upper right corner, while the horizontal lines indicate the FAP levels of 10% (solid red), 1% (dashed orange), and 0.1%(dotted green). Following lower panels: periodograms for the bisector inverse span, FWHM, ![]() , ΔV, and Vasy(mod) with Spearman correlation rank r and significance p with radial velocity data shown in each panel. The most significant periods for radial velocity data and residuals are highlighted in all panels as a red and green vertical dotted line, respectively, while the stellar rotation period is indicated by a blue vertical dotted line.
, ΔV, and Vasy(mod) with Spearman correlation rank r and significance p with radial velocity data shown in each panel. The most significant periods for radial velocity data and residuals are highlighted in all panels as a red and green vertical dotted line, respectively, while the stellar rotation period is indicated by a blue vertical dotted line.
Current usage metrics show cumulative count of Article Views (full-text article views including HTML views, PDF and ePub downloads, according to the available data) and Abstracts Views on Vision4Press platform.
Data correspond to usage on the plateform after 2015. The current usage metrics is available 48-96 hours after online publication and is updated daily on week days.
Initial download of the metrics may take a while.