Open Access
Fig. A.1.
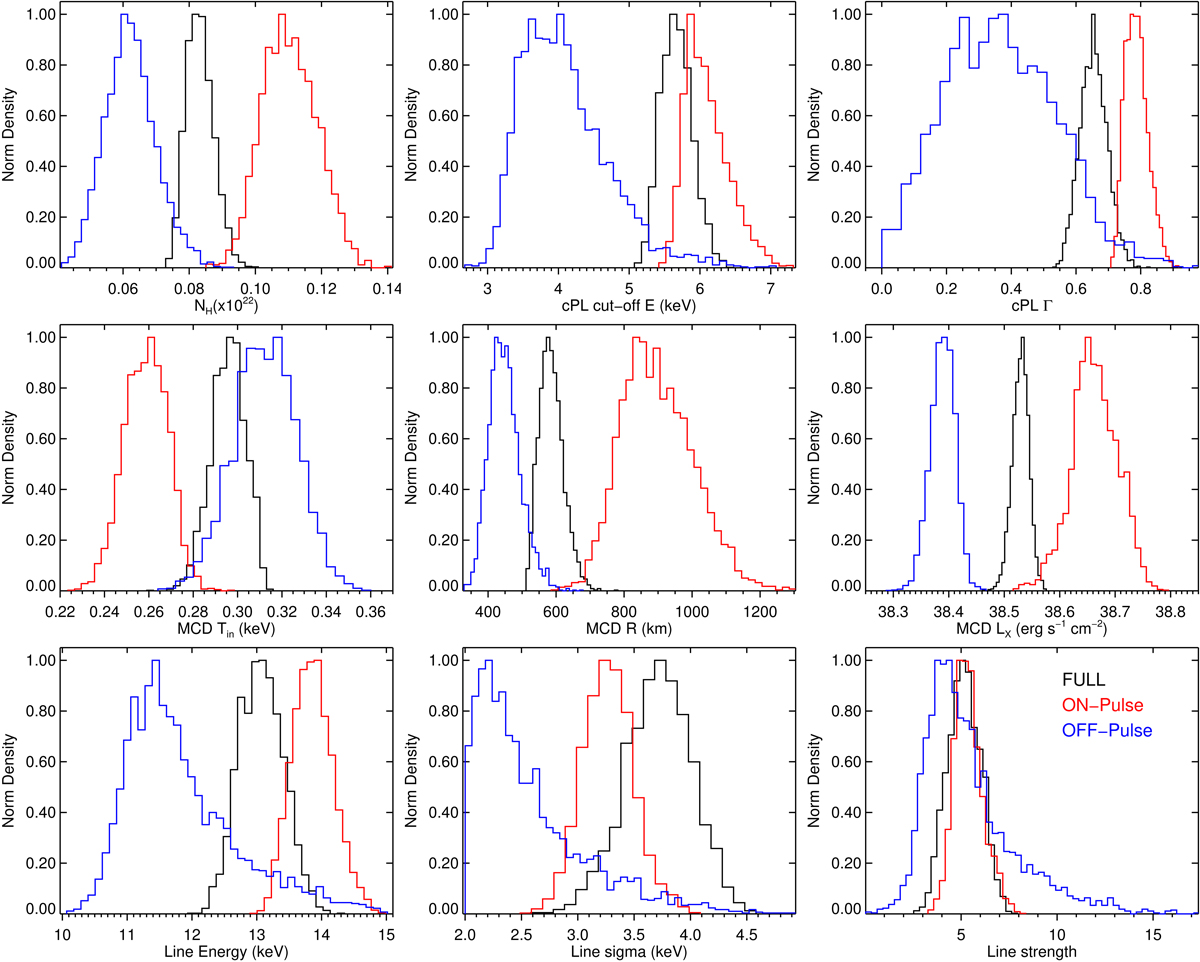
Marginalized parameters of the AC model. The panels contain the posterior probability density distributions, normalized to the maximum, for the phase-averaged (black lines), ON-pulse (red lines), and OFF-pulse (blue lines) spectra. The red lines mark the 5%, 50% (cross-section), and 95% percentiles of the 1D distributions.
Current usage metrics show cumulative count of Article Views (full-text article views including HTML views, PDF and ePub downloads, according to the available data) and Abstracts Views on Vision4Press platform.
Data correspond to usage on the plateform after 2015. The current usage metrics is available 48-96 hours after online publication and is updated daily on week days.
Initial download of the metrics may take a while.