| Issue |
A&A
Volume 672, April 2023
|
|
|---|---|---|
| Article Number | A140 | |
| Number of page(s) | 10 | |
| Section | Astrophysical processes | |
| DOI | https://doi.org/10.1051/0004-6361/202245048 | |
| Published online | 12 April 2023 | |
Probing the nature of the low state in the extreme ultraluminous X-ray pulsar NGC 5907 ULX1
1
Quasar Science Resources SL for ESA, European Space Astronomy Centre (ESAC), Science Operations Departement, 28692 Villanueva de la Cañada, Madrid, Spain
e-mail: This email address is being protected from spambots. You need JavaScript enabled to view it.
2
Centre for Astrophysics Research, University of Hertfordshire, College Lane, Hatfield AL10 9AB, UK
3
Institute of Astronomy, Madingley Road, Cambridge CB3 0HA, UK
4
INAF – Osservatorio Astronomico di Roma, Via Frascati 33, 00078 Monteporzio Catone, Italy
5
INAF – Osservatorio Astronomico di Cagliari, Via della Scienza 5, 09047 Selargius, Italy
6
CNRS, IRAP, 9 Av. colonel Roche, BP 44346, 31028 Toulouse Cedex 4, France
7
Cahill Center for Astronomy and Astrophysics, California Institute of Technology, Pasadena, CA 91125, USA
8
European Southern Observatory, Karl-Schwarzschild-Strasse 2, 85748 Garching bei München, Germany
9
Department of Physics, University of Rome “Tor Vergata”, Via della Ricerca Scientifica 1, 00133 Rome, Italy
10
Department of Physics and Astronomy, University of Southampton, Highfield, Southampton SO17 1BJ, UK
11
INAF – IASF Palermo, Via U. La Malfa 153, 90146 Palermo, Italy
12
INAF – IASF Milano, Via Corti 12, 20133 Milano, Italy
13
Centre for Extragalactic Astronomy & Department of Physics, Durham University, South Road, Durham DH1 3LE, UK
Received:
23
September
2022
Accepted:
23
January
2023
Abstract
NGC 5907 ULX1 is the most luminous ultra-luminous X-ray pulsar (ULXP) known to date, reaching luminosities in excess of 1041 erg s−1. The pulsar is known for its fast spin-up during the on-state. Here, we present a long-term monitoring of the X-ray flux and the pulse period between 2003 and 2022. We find that the source was in an off- or low-state between mid-2017 to mid-2020. During this state, our pulse period monitoring shows that the source had spun down considerably. We interpret this spin-down as likely being due to the propeller effect, whereby accretion onto the neutron star surface is inhibited. Using state-of-the-art accretion and torque models, we use the spin-up and spin-down episodes to constrain the magnetic field. For the spin-up episode, we find solutions for magnetic field strengths of either around 1012 G or 1013 G, however, the strong spin-down during the off-state seems only to be consistent with a very high magnetic field, namely, > 1013 G. This is the first time a strong spin-down is seen during a low flux state in a ULXP. Based on the assumption that the source entered the propeller regime, this gives us the best estimate so far for the magnetic field of NGC 5907 ULX1.
Key words: X-rays: binaries / X-rays: individuals: NGC 5907 ULX1 / accretion, accretion disks / magnetic fields / stars: neutron
© The Authors 2023
 Open Access article, published by EDP Sciences, under the terms of the Creative Commons Attribution License (https://creativecommons.org/licenses/by/4.0), which permits unrestricted use, distribution, and reproduction in any medium, provided the original work is properly cited.
This article is published in open access under the Subscribe to Open model. This email address is being protected from spambots. You need JavaScript enabled to view it. to support open access publication.
1. Introduction
A growing number of ultraluminous X-ray sources (ULXs), namely, off-nuclear X-ray binaries with apparent luminosities that exceed 1039 erg s−1 (see Kaaret et al. 2017 for a review), are now known to be powered by highly magnetized neutron star accretors (with magnetic fields of B ≫ 109 G). Six such sources have been discovered to date through the detection of coherent X-ray pulsations and thus classified as ultra-luminous X-ray pulsars (ULXPs): M 82 X-2 (Bachetti et al. 2014), NGC 7793 P13 (Fürst et al. 2016; Israel et al. 2017b), NGC 5907 ULX1 (Israel et al. 2017a), NGC 300 ULX1 (Carpano et al. 2018), NGC 1313 X-2 (Sathyaprakash et al. 2019) and M51 ULX7 (Rodríguez 2020). A few more candidates have been found through the tentative identification of pulsations (e.g., NGC 7793 ULX-4, Quintin et al. 2021) or the possible detection of cyclotron resonant scattering lines (e.g., M 51 ULX-8, Brightman et al. 2018). Additionally, the galactic source Swift J0243.6+6124 reached luminosities significantly above 1039 erg s−1 and can therefore also be classified as a ULXP (Wilson-Hodge et al. 2018; Tsygankov et al. 2018). Other similar sources include transient neutron stars with Be-star mass donors in the SMC, like SMC X-3 (Townsend et al. 2017; Liu et al. 2022) and RX J0209.6−7427 (Vasilopoulos et al. 2020; Hou et al. 2022), which also reached ULX level luminosities briefly during giant outbursts. While it is currently unclear if the accretion geometry during these outbursts is similar to persistent ULXPs or not (e.g., all ULXPs currently exhibit much higher luminosities), it shows that there is a clear connection between Be-X-ray binaries and ULXPs.
There is speculation that neutron stars could make up a significant fraction of the total ULX population (e.g., Pintore et al. 2017; Koliopanos et al. 2017; King et al. 2017; Middleton & King 2017; Walton et al. 2018c). Furthermore, there is significant debate over how exactly these neutron stars are able to reach such extreme luminosities and most of this debate is focused on the strength of the magnetic fields in these systems. Some authors argue for extremely strong, magnetar-level fields (B > 1013 G; e.g., Ekşi 2015; Mushtukov et al. 2015), as such fields suppress the electron scattering cross-section (Herold 1979) and permit higher luminosities for a given accretion rate, while others argue for much lower fields and accretion rates (B ≈ 1010–1011 G; e.g., Kluźniak & Lasota 2015; King et al. 2017) based on the large spin-up rates (Ṗ) observed.
Both scenarios, however, present some issues. The very strong magnetic field scenarios struggle to explain how accretion at luminosities below ∼1040 erg s−1 is possible since (in theory) the magnetosphere would stop accretion and the source would be in a permanent propeller state (see below). The low-magnetic field case on the other hand typically also assumes a very high beaming factor to explain the apparent extreme luminosities. This beaming would result in a very narrow funnel, which appears to be in contradiction to the observed sinusoidal pulse profiles with high pulsed fractions (Mushtukov et al. 2021). Additionally, the very high spin-up rate requires an intrinsically high accretion rate, setting up an argument against an extreme beaming factor.
It is also possible that a combination of these two explanations is present, with a very strong quadrupolar field acting close to the neutron star, whereas further away, the weaker dipolar field dominates (e.g., Israel et al. 2017a; Middleton et al. 2019; Kong et al. 2022). This scenario has been claimed for Swift J0243.6+6124, driven by the discovery of a cyclotron resonant scattering feature (CRSF) at up to 146 keV (Kong et al. 2022). This line energy implies a filed strength in the line-forming region (which is likely to be very close to the neutron star surface) of around 1.6 × 10¹³ G. Kong et al. (2022) have argued that such a strong field has to be in the multipolar component, as a dipole of this magnitude would lead to contradictions with other measurements. Nonetheless, it is currently unclear if the same scenario can explain the persistent ULXPs at even higher luminosities.
Reliably determining the magnetic fields of ULXPs has proven challenging to date. In general, the most robust method for determining field strengths in accreting neutron stars is via the study of cyclotron resonant scattering features (CRSFs; see Staubert et al. 2019 for a recent review). However, such features are challenging to detect in ULXs given their relatively low fluxes and the limited bandpass available for sensitive searches (even in the NuSTAR era). Only two potential features have been seen from the ULX population to date and these limited results paint something of a mixed picture (Brightman et al. 2018; Walton et al. 2018a; Middleton et al. 2019). Other potential means of estimating the magnetic field strengths in ULXPs are thus clearly of interest.
One thing a number of the known ULXPs have in common is that they show strong long-term variability, sometimes including transitions to “off-states” in which their X-ray flux drops by orders of magnitude (e.g., Motch et al. 2014; Earnshaw et al. 2016; Brightman et al. 2016). One possible explanation for these events is that they represent transitions to the propeller regime, in which the magnetic field of the neutron star (temporarily) acts as a barrier to accretion, resulting in a precipitous drop in the observed X-ray flux (Illarionov & Sunyaev 1975; Tsygankov et al. 2016; Earnshaw et al. 2018). If this is correct, then they may offer an independent means to estimate the dipolar magnetic fields of these sources. However, the nature of these events is not yet clear, and may differ for different systems and events. For example, in M 82 X-2 X-ray monitoring suggests that low-states are related to the ∼64 d super-orbital period seen in that system (Brightman et al. 2019), which would be somewhat challenging to reconcile with a propeller-based interpretation. Furthermore, other authors have suggested that these low-flux periods may be related to obscuration, instead of a cessation of accretion (Motch et al. 2014; Vasilopoulos et al. 2019; Fürst et al. 2021).
Among the known ULXPs NGC 5907 ULX1 is the most luminous, with an astonishing peak luminosity of LX ∼ 1041 erg s−1 (∼500 times the Eddington luminosity for a standard neutron star assuming a distance of d = 17.1 Mpc; Israel et al. 2017a; Tully et al. 2016), making it a case of particular interest. Coordinated observations with XMM-Newton and NuSTAR show that when the source is bright, it shows broadband spectra that are well described with a combination of a super-Eddington accretion disk that contributes thermal emission below ∼10 keV and an accretion column that dominates at higher energies (Walton et al. 2015, 2018c; Fürst et al. 2017). Studies of the short-timescale evolution of its pulse period revealed a potential orbital period of ∼5 d (Israel et al. 2017a; however, this period is not yet confirmed), and when in its ULX state the source is also known to exhibit a ∼78 d X-ray period (Walton et al. 2016), which is therefore likely to be super-orbital in nature. NGC 5907 ULX1 is also one of the ULXPs that is known to exhibit intermittent off-states (Walton et al. 2015). However, unlike the case of M 82 X-2, the low-flux periods in NGC 5907 ULX1 are not related to its super-orbital period and so, they could plausibly be related to the propeller transition.
As reported by Israel et al. (2017a), the earliest measurement of pulsations from NGC 5907 ULX1 are from February 2003, with a spin period P around 1.43 s. Eleven years later, the pulsar had spun-up to P ≈ 1.14 s (Israel et al. 2017a). Assuming a constant spin-up over this period implies a rate of change of the pulse period Ṗ = −8.1 × 10⁻¹⁰ s s−1. This long-term spin-up indicates that the pulsar was not at spin equilibrium and that the high mass accretion rate also resulted in a large increase of angular momentum. Similar long-term spin-ups are observed for other ULXPs, like NGC 7793 P13 (Ṗ ≈ −4 × 10⁻¹¹ s s−1, Fürst et al. 2021) and NGC 300 ULX1 (Ṗ ≈ −4 × 10⁻¹⁰ s s−1, Vasilopoulos et al. 2019).
As the spin-up is driven by transfer of angular momentum through accretion, this can also be theoretically used to measure the magnetic field strength. This fact has been discussed in detail by the seminal papers by Ghosh & Lamb (1979a,b), which were subsequently updated by Wang (1995). However, those calculations are based on various simplifications, in particular, they assume a geometrically thin, optically thick accretion disk as expected for sub-Eddington accretion rates (Shakura & Sunyaev 1973). In ULXPs, however, we expect the accretion disk to be geometrically thick due to their super-Eddington accretion rates (Shakura & Sunyaev 1973; Abramowicz et al. 1988). Nonetheless, using the Ghosh & Lamb (1979b) model for ULXPs NGC 7793 P13 and NGC 300 ULX1, magnetic fields around 1012 G were implied (Fürst et al. 2016; Carpano et al. 2018), which is very well in line with the magnetic fields observed in high-mass X-ray binaries in our own galaxy (see, e.g., Staubert et al. 2019).
For NGC 5907 ULX1, much higher magnetic fields have been postulated based on the extreme luminosity, with a multipolar magnetic field component as high as a few 1014 G (Israel et al. 2017a). More recently, using an updated description of the coupling between the magnetic field and the accretion flow intended to be more suitable for a super-Eddington disk, Gao & Li (2021) estimated a maximal field between 2 and 3 × 10¹³ G. These authors, however, find that the observations presented by Israel et al. (2017a) are also consistent with a field around 6 × 10¹¹ G.
We are therefore in need of another approach to constrain the magnetic field. One possibility is to study the expected spin-down during a low flux phase, in which accretion might be inhibited due to the fast rotation of the neutron star. In this regime, the spin-down torque onto the neutron star is dominated by the magnetic field interacting with the residual accretion disk (Parfrey et al. 2016). NGC 5907 ULX1 entered a suitable low-flux state in mid-2017, which, broadly speaking, lasted until mid-2020, with brief episodes of higher flux in between. In this paper, we discuss the pulse period evolution before, during, and after this extended off-state, as observed with XMM-Newton, and show that the pulsar spun-down significantly during the off-state.
The remainder of the paper is structured as follows. In Sect. 2, we describe the data used and extraction methods. In Sect. 3 we discuss the flux and period evolution and describe our pulsation search in detail. In Sect. 4, we discuss our results and use the measurements to estimate the magnetic field. Section 5 provides a conclusion, along with a summary of our main results and an outlook for future measurements.
2. Observations and data reduction
2.1. Swift
NGC 5907 ULX1 has been extensively monitored by the Neil Gehrels Swift Observatory and, in particular, the X-ray telescope (XRT; Burrows et al. 2005). The Swift/XRT light curve (Fig. 1) is extracted using the standard online pipeline (Evans et al. 2009), primarily using time bins of four days while the source was bright (following Walton et al. 2016). The exception to this is when NGC 5907 ULX1 drops its flux significantly. During these periods, we revert to an approximately monthly binning. The average count rates for these broader bins are determined by extracting XRT images and exposure maps integrated across them, also using the online XRT pipeline, and calculating the net count rate observed using a circular source region of radius 10″ and a much larger neighboring region to estimate the background. Uncertainties are calculated following Gehrels (1986). Where the source is not detected, an upper limit at the 3σ-level is calculated using the method outlined by Kraft et al. (1991). These rates and upper limits are then corrected for the fraction of the XRT PSF that falls outside of the source extraction region. The Swift monitoring snapshots do not provide enough photons to search for or measure the pulse period.
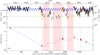 |
Fig. 1. Flux and period evolution of NGC 5907 ULX1 between 2014 and 2022. Top: Swift/XRT light curve (0.3–10.0 keV). In green the upper limit for the point source luminosity as measured with Chandra (Belfiore et al. 2020) is shown, using the right y-axis. The XMM-Newton luminosities are shown as red diamonds and orange squares for observations with and without detect pulsations, respectively, also using the right-hand y-axis. The horizontal green line indicates the estimated propeller luminosity based on a magnetic field strength of B = 2.6 × 10¹³ G (see Table 3). The blue curve shows an extrapolation of the 78 d X-ray period seen from NGC 5907 ULX1 during its ULX state (Walton et al. 2016). The shaded pink areas indicate where the source was conceivably in the low state and spinning down. Bottom: pulse period measurements, as listed in Table 1 and Israel et al. (2017a). The gray vertical dotted lines indicate times of observations with XMM-Newton. The blue dashed line shows a possible fiducial model of epochs of spin-up during bright states interspersed with spin-down during off-states. This line is only a suggestion for the evolution of the period. For details see text. |
2.2. XMM-Newton
In order to understand the nature of the strong variability seen by Swift, we executed a series of XMM-Newton observations over the last few years designed to monitor the spin period of the source, both across and after the extended low-flux period seen from ∼2017 to 2020. In addition, XMM-Newton also performed a series of earlier observations extending as far back as 2003. Details of these observations are given in Table 1.
Details of the XMM-Newton observations of NGC 5907 ULX1 considered in this work.
For all of these XMM-Newton observations (see Table 1), the EPIC detectors (EPIC-pn, EPIC-MOS; Strüder et al. 2001; Turner et al. 2001) were operating in full-frame mode. We therefore focus on the data taken by EPIC-pn here (temporal resolution of 73.4 ms), as the EPIC-MOS detectors do not have sufficient timing capabilities to probe the ∼1 s spin period of the neutron star (temporal resolution of ∼2.6 s). Data reduction was carried out with the XMM-Newton Science Analysis System (SAS v19.1.0), largely following standard procedures. The raw observation data files were processed using EPCHAIN and the cleaned event files corrected to the solar barycenter using the DE200 solar ephemeris with BARYCEN. Source light curves were then extracted on the time resolution of the EPIC-pn detector with XMMSELECT. We typically used circular source regions of radius 25–30″, depending on the brightness of NGC 5907 ULX1, although for some of the extremely faint observations, even smaller regions were occasionally used (ranging down to ∼15″). As recommended we only considered single and double patterned events.
In all cases, the background was estimated from larger regions of blank sky on the same detector as the source region. Given the large number of XMM-Newton observations considered, it is unsurprising to notice that a broad range of background activity is seen among them; some suffer from severe flaring, some show brief, modest periods of enhanced background and some show a stable background level throughout. In order to determine whether additional background filtering is required – and, if so, then subsequently establishing the level of background emission that is acceptable – we utilized the method outlined in Piconcelli et al. (2004). This determines the background level at which the signal-to-noise (S/N) of the source is maximized. We make this assessment for each observation individually, and maximize the S/N over the 0.3–10.0 keV band. For cases where additional background filtering is required, custom good-time-intervals are generated to exclude background levels above that which gives the maximum S/N for the source.
3. Timing analysis
3.1. Light curve and flux evolution
The evolution of NGC 5907 ULX1 from early 2014 to early 2022 as seen by Swift is shown in Fig. 1. Before 2014, no dense monitoring of the source is available, although there are a small number of observations with XMM-Newton, Swift, and NuSTAR prior to this. The source faded significantly in 2017 – to the extent that it became challenging to detect with Swift and only returned to full activity briefly in ∼May 2019; we note that there was also a brief re-brightening in ∼March 2018, but the source did not fully return to its “normal” ULX state. This low-flux period ended in mid 2020, and since then NGC 5907 ULX1 has been detected in almost every Swift snapshot obtained. Despite the broad recovery, comparing the behavior before 2017 and after 2020, we can see that the source is still exhibiting a much larger variability in the more recent data, with flux changes of up to a factor of ∼10 within a few months.
Previously, NGC 5907 ULX1 was also in a low flux state between 2012 and 2014 (see Walton et al. 2015), but its duration and exact luminosities are unclear due to the lack of monitoring. Between 2003 and 2012 the source seems to have largely been in a bright on-state, as seen by Swift, XMM-Newton, and Chandra (Israel et al. 2017a).
Fortuitously, during the initial decline in flux in 2017 a series of five XMM-Newton observations were taken, allowing us to obtain a precise measurement of the neutron star spin just before the low state (Table 1). The activity period in early 2019 was sufficiently bright and long-lived for us to trigger another series of ten XMM-Newton observations in order to compare the properties of NGC 5907 ULX1 in 2017 and 2019 and determine how the source has evolved across the extended low-flux period in between. Furthermore, another series of seven XMM-Newton observations of NGC 5907 ULX1 have been performed since its more persistent recovery in mid-2020, allowing for further comparisons of the recent behavior with that seen in 2019 as well as prior to 2017. In particular, we focus on timing the pulsar and tracking the evolution of its spin period in this work.
3.2. Pulsations
As a simple first step in the timing analysis we performed a Fast-Fourier Transform (FFT) on all full-band EPIC-pn light curves, extracted with a time resolution of 73.4 ms. This approach revealed significant pulsations at ∼0.9812 Hz in ObsID 0824320201 (2019-06-12). In all other observations, no significant signal was found using this basic analysis.
Based on the variation of the pulsed fraction as function of energy available in the literature (Israel et al. 2017a), we find that below 1 keV the pulsations are barely detectable. We therefore subsequently filtered all data on energies > 1 keV for the following analysis to increase the S/N. Following this additional filtering, as a next step, we performed a more in-depth pulsation search using an accelerated Fourier method, which searches a grid in the frequency, ν, and frequency-derivative  space. We used the implementation HENaccelsearch from the HENDRICS software package (Bachetti 2015) and performed the search between ν = 0.9 and 1.2 Hz. This analysis revealed good pulsation candidates in ObsIDs 0804090301, 0804090401, 0824320201, 0823430401, and 0891801501, with a detection significance of > 3σ.
For each of these observations, the best  combinations from this search were then analyzed in more detail, with a grid search using epoch folding (Leahy et al. 1983). The data were searched in temporal space across a range of ΔP = ±0.3 ms and ΔṖ± = 1 × 10⁻⁸ s s−1, respectively, centered on the best values from HENaccelsearch. We oversampled the search in P by a factor of 5 compared to the number of independent frequencies and used the same number of grid points also in Ṗ space. This analysis is performed with ISIS (Houck & Denicola 2000), following a similar procedure to that described in Fürst et al. (2016). Uncertainties on P and Ṗ are given as the value where χ2 has dropped to half its maximum value, namely, an FWHM width based on the χ2 landscape in the P–Ṗ plane.
The results of this search are given in Table 1 and shown in the bottom panel of Fig. 1. It is clear from these results that the neutron star was spinning significantly slower in 2019 compared to 2017 and again slightly slower in 2020 compared to 2019. After mid 2020, NGC 5907 ULX1 can be seen to have restarted its steady spin-up trend.
We then also performed the same epoch folding search for all ObsIDs where HENaccelsearch did not find a significant signal. The searches were centered on a period obtained from linear interpolation or extrapolation between the neighboring pulsation detections. We increased the search range to ΔP = 3 ms and ΔṖ = 5 × 10⁻⁸ s s−1 and again oversampled the P space by a factor of 5. Larger grids are computationally prohibitive for this kind of brute force method. We did not find significant pulsations in any of these observations.
The pulse periods we give here are not corrected for the orbital motion of the neutron star. We chose not to perform this correction given the large uncertainties on the current ephemeris (Israel et al. 2017a). However, taking the values given by Israel et al. (2017a) and their respective uncertainties, we find that the maximal influence of their orbital solution on the measured spin-period is on the order of 0.2 ms. This is smaller than the difference in spin period that we find between the two 2019 observations – and much smaller than the differences between the 2017 and 2019 observations.
3.3. Pulsed fraction
Where pulsations have been detected, we calculate the pulsed fraction based on the pulse profile (PP) as
 (1)
(1)
For observations without detected pulsations, we instead calculate the upper limits on the pulsed fraction. To do so, we simulate a series of event lists with the same GTIs and average count rate as the real data but adding sinusoidal pulsations with an increasing pulsed fraction. The period assumed for these pulsations is based on the closest measured periods and is determined by linearly interpolating the evolution of the pulse period between these measurements to the time of the observation in question. For each pulsed fraction, we simulated 50 individual event lists and performed the same search for pulsations as applied to the real data. We consider pulsations to be detected in our simulated datasets when we find a peak at the 99.9% significance level or above. Starting from 5%, the pulsed fraction is increased in steps of 0.1% up to the point where the fraction of simulations that return significant pulsations increases above 90% (i.e., the pulsations are recovered in at least 45 simulated event lists). We take this pulse fraction to be the upper limit for the observation in question (Table 1).
4. Results and discussion
4.1. Magnetic field based on spin-up strength
As seen in Fig. 1, we can identify two epochs of relatively stable spin-up, the first one between 2014 and 2017 (starting around MJD 56847) and the second one after mid 2020 (starting around MJD 59053). In addition, based on the results presented in Israel et al. (2017a), the source was also spinning up on average between 2003 and 2014 (starting around MJD 52690). However, we do not know how stable the spin-up and X-ray flux was between 2003 and 2014, due to the lack of regular monitoring. Using these three spin-up episodes, we can try to estimate the magnetic field strength based on theoretical calculations describing how the accreted matter couples to the neutron star via the magnetic field, as well as how much angular momentum is transferred by this coupling. Throughout the remainder of this paper, we assume a neutron star radius R = 106 cm and a neutron star mass of M = 1.4 M⊙, unless otherwise noted.
To understand the accretion torque on the neutron star, it is important to analyze the relationship between a number of important radii at which significant changes in the geometry or the dominating physical processes occur. These are detailed below.
The corotation radius, Rc, is the radius at which the Keplerian orbital speed is equal to the rotational speed of the pulsar. High accretion rates can only occur if the accreted material couples inside this radius to the magnetic field. The corotation radius is given by:
 (2)
(2)
Next, there is the magnetospheric radius, RM, which is the radius at which the magnetic field dominates over the ram pressure of the accreted material and within which the material has to follow the magnetic field lines. This is equivalent to the inner radius of the accretion disk, and is related to the Alfvén radius computed for spherical accretion with a factor ξ:
 (3)
(3)
Then we have the spherization radius, Rsph, the radius at which the accretion becomes locally super-Eddington and geometrically thick. Following Shakura & Sunyaev (1973), this is given by:
 (4)
(4)
In the above expressions, P is the pulse period in seconds, M1.4 is the neutron star mass in units of 1.4 M⊙, μ is the magnetic moment, G is the gravitational constant, Ṁin is the accretion rate at the inner edge of the accretion disk, Ṁtot is the total mass transfer rate, and LEdd is the Eddington luminosity. For a dipolar magnetic field, μ = BR3, where B is the magnetic flux density of the dipolar field.
The problem in calculating these radii lies in the fact that they depend on Ṁtot as well as Ṁin, which, in principle, can be inferred from the observed luminosity, L. However, the relation between Ṁin and the luminosity itself depends on the relative location of Rsph, RM, and RC.
Within Rsph, the outflows will ensure that the local Eddington luminosity is not exceeded, leading, at the same time, to the formation of a funnel that will go on to collimate the observed emission. As discussed by King (2009), for high accretion rates in the super-Eddington regime, we have:
 (5)
(5)
where ṁ = Ṁtot/ṀEdd, ṀEdd is accretion rate that corresponds to the Eddington limit and b is the beaming factor, which can be approximated as b ≈ 73/ṁ2. High accretion rates in this case mean ṁ > 8.5 (King et al. 2017), which is the case for all observations of NGC 5907 ULX1 considered here.
The estimated mass accretion rate Ṁtot from Eq. (5) can be used to calculate Ṁin, which is the relevant accretion rate for determining RM. For the same reasons as discussed for the luminosity, Ṁin is rising slower than Ṁtot inside of Rsph to guarantee that the disk does not locally exceed its Eddington limit. In particular, following (cf. Erkut et al. 2019; Shakura & Sunyaev 1973):
 (6)
(6)
Finally, in order to calculate RM, we have to determine ξ, the conversion factor for the Alfvén radius calculated under the assumption of spherical symmetry. The value of ξ depends strongly on our assumptions of how the accreted material couples and interacts with the magnetic field, depending on the magnetic field geometry. Gao & Li (2021) distinguish two cases of the ratio between the azimuthal and vertical B-field strength which describe different physical regimes of the coupling between the accretion disk and the magnetosphere (see also Wang 1995). These two cases lead to different expressions of the total dimensionless torque n(ω), where ω is the so-called fastness parameter. The exact expressions of these equations can be found in Gao & Li (2021). Based on the description of the transfer of angular momentum onto a rigidly rotating neutron star, we can solve for ω. These equations are at least quadratic in ω, leading to two solutions for each case. We can then solve for the magnetic field, using the following equations (Gao & Li 2021). For RM ≥ Rsph:
 (7)
(7)
And for RM ≤ Rsph:
 (8)
(8)
Here, ξ can be approximated with:
 (9)
(9)
which is the same regardless of whether the magnetospheric radius is larger or smaller than the spherization radius. Also, R6 is the neutron star radius in units of 106 cm.
Given the high luminosity of NGC 5907 ULX1, we expect that the spherization radius tends to be outside of RM. However, for certain combinations of magnetic field strengths and coupling assumptions, we can also find that this may not be the case. For these potential solutions, the magnetic field is so strong that it disrupts the accretion disk before it can become locally super-Eddington. We have up to four B-field estimates in each case, however, not all estimates fulfill the assumptions (i.e., for an overly strong magnetic field, RM might be outside of Rsph, making the solutions for RM ≤ Rsph invalid in this case). In Table 2, we list all possible solutions for the three spin-up epochs, that is, for each set of input values, L, P, and Ṗ.
Implied magnetic field strength for three different epochs following the method given by Gao & Li (2021).
As can be seen in Table 2, we find roughly similar magnetic field strengths for epochs 2 and 3, but a different value for epoch 1. The long baseline for estimating Ṗ in this epoch and the lack of flux monitoring can explain this difference: the average Ṗ and L are likely to be inaccurate, leading to unreliable estimates. Epochs 2 and 3 show a particularly good agreement for the high B-field solution, with a variation of only < 10% for both cases, while the difference for the low B-field solution is around ∼50%. Nonetheless, without further information, we cannot determine which solution describes the true nature of the system better.
If we assume that the neutron star has a B-field of 2.0 × 10¹³ G (roughly the average of the high-B solutions based on epochs 2 and 3), we can also estimate the average luminosity during epoch 1, which comes out to about 7 × 1039 erg cm−2 s−1. While this value may be a bit on the low side, it could be realistic, given that NGC 5907 ULX1 did seemingly exhibit low fluxes throughout much of 2013 (Walton et al. 2015). In this case, RM > Rsph, as the luminosity is very low compared to the magnetic field.
Even with this lower estimated luminosity for epoch 1, the low B-field solution does not agree with the other epochs. This discrepancy is mainly due to the fact that the B-field estimate is independent of the luminosity as long as RM < Rsph, as the mass accretion rate at the inner accretion disk edge is regulated by the Eddington limit.
4.2. The off-state
In the simplest picture, an accreting neutron star will enter the propeller (or centrifugal inhibition) regime as soon as the corotation radius is inside the magnetospheric radius (RM > Rc). At the magnetospheric radius, matter couples to the magnetic field and is forced to rotate at the angular speed of the neutron star. In the case of RM > Rc, this rotation is faster than the Keplerian speed and therefore the matter experiences a net outward force, all but halting direct accretion. The accretion luminosity will then drop by orders of magnitude, however, residual accretion at the magnetosphere might still be present, that is, the source does not have to appear completely off (see, e.g., Corbet 1996).
We can find the critical mass accretion rate for the transition to propeller regime, Ṁin,crit by equating Rc = RM (using Eqs. (2) and (3)), leading to:
 (10)
(10)
 (11)
(11)
Based on this calculation, we give the critical luminosity for each epoch and case in Table 2, which is Lcrit = Ṁin,critϵc2, where ϵ = 0.15, the accretion efficiency of a typical neutron star on its surface. Given that the critical luminosity depends strongly on the magnetic field, the estimates differ more strongly, for instance, by a factor of 2 for the low B-field case (again, only comparing epochs 2 and 3).
Observationally, we can also estimate the luminosity of a possible onset of the propeller effect from the Swift/XRT light curve, by finding the flux at which the source drops below the detection limit of XRT. To estimate this luminosity we transferred the Swift count-rate to flux and luminosity based on the contemporaneous XMM-Newton data. We use a conversion factor of:
 (12)
(12)
As can be seen on the right-hand y-axis of Fig. 1, the source drops below the detection limit of Swift around 1–2×1039 erg s−1. XMM-Newton detects the source around 1 × 1039 erg s−1 during the lowest flux states, but no pulsations were found. This luminosity is therefore a good upper limit for the onset of the propeller effect and we refer to it as the propeller luminosity. That value is consistent with the fact that pulsations were only detected down to 14 × 1039 erg s−1 in July 2017 (ObsID 0804090401).
While XRT is not very sensitive, we know that accretion was heavily suppressed in November 2017, due to a deep Chandra observation. This Chandra observation revealed a diffuse nebula around the ULXP and provided a stringent upper limit of L < 1.2 × 1038 erg s−1 for the point source (Belfiore et al. 2020). We include this upper limit in Fig. 1.
The observational limit of 1 × 1039 erg s−1 for the propeller luminosity is a little bit below the luminosity implied by the highest estimated B-field from the spin-up (Table 2), namely, Lcrit = 2.2 × 1039 erg s−1 for a magnetic field of B = 2.6 × 10¹³ G (orange dotted-dashed line in Fig. 1).
It is worth stressing that the initial decline in flux seen during the dense XMM-Newton monitoring in July 2017 is not itself related to the propeller transition in our interpretation. Rather, this must be related to some other physical effect that resulted in a gradual reduction in the overall accretion rate through the disk and the disk itself is also expected to make a significant contribution in the XRT band (see, e.g., Walton et al. 2018b). For example, density waves in the accretion disk might have reduced the reduced the inner accretion rate or perhaps the mass transfer rate from the stellar companion decreased slightly. We consider this initial stage of the decline to be similar to the behavior seen in 2021 and 2022, where the source also shows significant flux variability without fully entering an off-state. However, in 2017 the flux continued to drop even further, to the point where it reached our proposed propeller luminosity, resulting in a transition to the propeller regime. This transition would naturally explain the very stringent upper limit observed in November 2017 by Chandra. However, as this observation occurred about 4 months later, we cannot make any firm statement with regards to how rapidly the actual propeller transition would have occurred with these data and, unfortunately, the XRT does not have the sensitivity to meaningfully shed light on this issue either (the source is already not detected by the XRT at our propeller luminosity). We note, however, given the rise by two orders of magnitude (or more) in flux in only four days, as seen by Walton et al. (2015) using XMM-Newton and NuSTAR, these observations (taken in 2013) may provide the most stringent constraints on this issue.
We can also follow a more detailed description of the super-Eddington accretion disks put forward by Chashkina et al. (2017, 2019). Their model in particular takes advection of material in the accretion disk into account, as well as illumination of the disk by the luminosity emitted close to the compact object.
For a radiation-dominated disk, they find an updated description of the inner disk radius, which does not depend on the mass accretion rate (Eq. (61) in Chashkina et al. 2017):
 (13)
(13)
where α is the viscosity of the disk, based on the standard Shakura & Sunyaev (1973) description and  . We assume α = 0.1. Here μ30 is the magnetic moment of the neutron star in units of 1030 G cm−3 and c is the speed of light.
Assuming that we reach the equilibrium spin-period just before entering the off-state, that is, a period of P = 0.946 s as measured in July 2017, we can equate RM = Rc and then estimate a magnetic field of around 6 × 10¹³ G. A similar estimate is found when following the description of King et al. (2017), who use the standard formula for the magnetospheric radius (Eq. (3)).
Based on our assumption that NGC 5907 ULX1 is spinning close to equilibrium and assuming that it entered the propeller state at the lowest measured luminosity where pulsations were still detected (in July 2017), we can rewrite the limit on the mass-accretion rate given Eq. (33) of Chashkina et al. (2019) to estimate the B-field:
 (14)
(14)
Again, we use the measurements of July 2017 (ObsID 0804090401), that is, P = 0.946 s and based on Eq. (5), ṁ = 31.9 and we approximate ξ = 0.75 (based on Eq. (9)), we find a B-field of around B ≈ 1.7 × 10¹³ G. This estimate is slightly lower due to the effects of irradiation and advection in this model.
If we assume that NGC 5907 ULX1 entered a propeller state when it became undetectable by Swift, we would also expect that the source spins-down during this period. This behavior is indeed what we observe, as the spin period in 2019 is significantly slower than in 2017, just before the off-state.
However, the source rebrightened briefly in 2018, which likely means that it started accreting and spinning-up again. We do not have a pulsation measurement for this period, thus estimating the spin-down strength is not straight forward. In the bottom panel of Fig. 1, we indicate a possible spin-history of the source. We define regions (shaded pink) in which the source is off and spinning-down, thereby splitting up the data into seven time slices that alternate between spin-up and spin-down.
In this model, we assume a spin-up strength of Ṗ = −2.03 × 10⁻⁹ s s−1 between 2014 and 2017 and a spin-up strength of Ṗ = −1.50 × 10⁻⁹ s s−1 during all other spin-up episodes. For the spin-down, we assume a value of Ṗ = 2.25 × 10⁻⁹ s s−1, which is based on a spin-down estimate during the off-state in 2020.
This model is of course highly simplified and averages over long periods of time. It is possible that during the periods where the source was detected in XRT at ∼1039 erg s−1, active accretion occurred and the source was spinning-up slightly (or at least, was not spinning down further) if RM ≈ RC. However, the current data do not provide the required sensitivity and time resolution to model the spin history on shorter time-scales.
Theoretical estimates of the spin-down strength during the propeller state are difficult and depend on various assumptions of the interaction between the magnetic field and the residual surrounding matter (e.g., Davies et al. 1979; Urpin et al. 1998; Ikhsanov 2001; D’Angelo & Spruit 2010). Here we follow calculations presented by Parfrey et al. (2016), which were originally motivated by millisecond pulsars. In particular, these calculations assume that the spin-down torque is completely dominated by the torque exerted by the open field-lines and that there is no interaction between the field and the disk inside the co-rotation radius. Based on Eq. (18) of Parfrey et al. (2016) we can write an estimate for the magnetic field:
 (15)
(15)
where I is the moment of inertia of the neutron star ( ). The parameter ζ describes how efficiently the magnetic field lines are opened by the star-disk interaction. Here, we assume maximum efficiency, namely, ζ = 1, which implies that all field lines intersecting the disk are opened.
We measured an average spin-down Ṗ = 1.19 × 10⁻⁹ s s−1 between mid 2017 and mid 2019, that is, over the two first off-states. The spin-down is likely a bit faster, given the short re-brightening of NGC 5907 ULX1 in 2018 (see Fig. 1). Nevertheless, with this value for Ṗ, we find Bdown = 6.83 × 10¹³ G. This magnetic field strength is slightly higher than the largest value based on the spin-up calculations, but only by a factor of about 2–3. Given the significant number of simplifications and approximations going into this estimate, it is probably not surprising that we don’t find a perfect agreement. An overview of all our B-field estimates is given in Table 3.
Summary of magnetic field estimations with the different methods presented in this work.
It is interesting to note that the source already showed a significant spin-down between two XMM-Newton observations in 2017 (OBSIDs 0804090301 and 0804090401). These were taken while the source was on its decline into the off-state – and were separated by only ∼3 d. The evolution between these two observations implies Ṗ ≈ 1.4 × 10⁻⁹ s s−1, which is similar to what we measured between 2017 and 2019. We note, however that both observations are still significantly above the propeller luminosity that would correspond to a 1013 G magnetic field, so there would appear to be an inconsistency here. Assuming an orbital period of 4.4 d, the lower limit of the period proposed by Israel et al. (2017a), we find that the observed spin-down is barely consistent with being due to the orbital motion within the uncertainties. However, the orbital period is not confirmed, so we cannot draw firm conclusions on the nature of this spin-down.
Another possibility for the observed spin-down is that the source is entering the subsonic propeller (or magnetic inhibition) regime. In this regime, RM < RC, but the matter is still too hot to enter the magnetosphere and accrete. This regime was discussed in detail by Davies et al. (1979), Davies & Pringle (1981) and Ikhsanov (2007). Following Davies & Pringle (1981) and Henrichs (1983), we can write a simple expression for the expected magnetic field given an observed spin-down rate:
 (16)
(16)
With the same spin-down rate assumptions as above, this would imply BSSP = 8.85 × 10¹² G. While still high, this estimate is significantly lower than the ones obtain before, as expected from the different assumptions regarding the state of the source. It is difficult to estimate the luminosity at which the subsonic propeller would start, given that it strongly depends on the wind density, temperature, and turbulence just outside the magnetosphere – which are all unknown.
4.3. The super-orbital period
Walton et al. (2016) discovered flux variability with a period of 78.1 ± 0.5 d in the Swift/XRT data of NGC 5907 ULX1, using data from roughly weekly monitoring observations between 2014 and 2016. The period showed a peak-to-peak amplitude of roughly a factor of 3 and was interpreted as a super-orbital period. As can be seen in Fig. 1, the flux just before the off-state in 2017 follows the exact same period, with a very similar amplitude and phase. This is also true for the recovery after the off-state in 2020: the XRT flux measurements align very well within the uncertainties of the period with the extrapolated profile of the 78 days period. Since 2020, NGC 5907 ULX1 shows a somewhat larger variability in its flux, with variations of at least a factor of 10. This increase in variability makes identifying the 78 days period more difficult, nonetheless, the bright states in the data still largely line up well with the peaks of the predicted profile. The Swift/XRT monitoring is still ongoing to investigate the stability of this period. The current data do not allow for a independent measurement of the period, so we currently cannot say if there is a change in the period after the off-state or not.
5. Conclusions
We have studied the pulse period evolution of NGC 5907 ULX1 between 2003 and 2022. In 2017, the source entered an extended off-state, during which it dropped below the detection limit of Swift/XRT. During this off-state the secular spin-up trend reversed, and the neutron star rotational period slowed down significantly. After the source left the off-state in mid-2020, spin-up has resumed albeit at a lower rate than before.
We have used different methods to estimate the magnetic field of the neutron star, either based on the spin-up or spin-down strength. The main results are summarized in Table 3. In particular, we used the torque transfer model presented by Gao & Li (2021) during the spin-up. We find that the calculated field strengths agree well for the two most recent spin-up episodes in 2014–2017 and 2020–2022, in particular, for the high B-field solution. The first epoch between 2003 and 2014 gives very different estimates, but due to the lack of continuous flux monitoring, the estimated X-ray flux is highly uncertain. The highest estimate for the magnetic field strength in our data is ≈2.5 × 10¹³ G, while for the low B-field solution, we find values as low as 2 × 10¹² G. While based on these numbers we cannot distinguish which magnetic field is present in reality, we note that for a ∼1012 G field, we would expect to see a cyclotron resonant scattering feature (CRSF) around 12 keV, which so far has not been observed in the spectrum (Staubert et al. 2019; Fürst et al. 2017; Israel et al. 2017a).
We also estimate the magnetic field based on the spin-down during the off-state between 2017 and 2019. If we assume that the source entered the propeller regime when it dropped below the detection limit of Swift/XRT at about L = 1–2×1039 erg s−1, we estimate a magnetic field of B ≤ 2.5 × 10¹³ G. Using the update disk description of Chashkina et al. (2019), we find that this luminosity for the propeller transition implies a magnetic field B ≈ 1.7 × 10¹³ G. The spin-down torque itself is difficult to estimate as it depends on the unknown interaction between the magnetic field and the residual matter surrounding it, be it the stellar wind or a residual accretion disk. We performed our calculations based on a description by Parfrey et al. (2016) and again find that the strong spin-down can only be explained with a very high magnetic field (≈6.8 × 10¹³ G). If we assume that the source was spun down while in the subsonic propeller regime, we find a magnetic field of around 8.9 × 10¹² G.
While we cannot rule out a low magnetic field directly, circumstantial evidence points clearly toward the direction of a magnetic field of a few 1013 G in NGC 5907 ULX1. This value is in line with previous estimates of the magnetic field (e.g., Israel et al. 2017a; Gao & Li 2021) and implies that the source is accreting at very high rates.
Acknowledgments
The authors would like to thank the referee for their useful feedback, which helped to improve the final version of the manuscript. D.J.W. acknowledges support from an STFC Ernest Rutherford Fellowship. T.P.R. acknowledges support from the Science and Technology Facilities Council (STFC) as part of the consolidated grant award ST/000244/1. This research has also made use of data obtained with XMM-Newton, an ESA science mission with instruments and contributions directly funded by ESA Member States, and has also made use of public data from the Swift data archive. We thank Kyle Parfrey for the useful discussion. This work made use of data supplied by the UK Swift Science Data Centre at the University of Leicester.
References
- Abramowicz, M. A., Czerny, B., Lasota, J. P., & Szuszkiewicz, E. 1988, ApJ, 332, 646 [Google Scholar]
- Bachetti, M. 2015, Astrophysics Source Code Library [record ascl:1502.021] [Google Scholar]
- Bachetti, M., Harrison, F. A., Walton, D. J., et al. 2014, Nature, 514, 202 [NASA ADS] [CrossRef] [Google Scholar]
- Belfiore, A., Esposito, P., Pintore, F., et al. 2020, Nat. Astron., 4, 147 [Google Scholar]
- Brightman, M., Harrison, F., Walton, D. J., et al. 2016, ApJ, 816, 60 [Google Scholar]
- Brightman, M., Harrison, F. A., Fürst, F., et al. 2018, Nat. Astron., 2, 312 [CrossRef] [Google Scholar]
- Brightman, M., Harrison, F. A., Bachetti, M., et al. 2019, ApJ, 873, 115 [Google Scholar]
- Burrows, D. N., Hill, J. E., Nousek, J. A., et al. 2005, Space Sci. Rev., 120, 165 [Google Scholar]
- Carpano, S., Haberl, F., Maitra, C., & Vasilopoulos, G. 2018, MNRAS, 476, L45 [NASA ADS] [CrossRef] [Google Scholar]
- Chashkina, A., Abolmasov, P., & Poutanen, J. 2017, MNRAS, 470, 2799 [Google Scholar]
- Chashkina, A., Lipunova, G., Abolmasov, P., & Poutanen, J. 2019, A&A, 626, A18 [NASA ADS] [CrossRef] [EDP Sciences] [Google Scholar]
- Corbet, R. H. D. 1996, ApJ, 457, L31 [NASA ADS] [CrossRef] [Google Scholar]
- D’Angelo, C. R., & Spruit, H. C. 2010, MNRAS, 406, 1208 [NASA ADS] [Google Scholar]
- Davies, R. E., & Pringle, J. E. 1981, MNRAS, 196, 209 [CrossRef] [Google Scholar]
- Davies, R. E., Fabian, A. C., & Pringle, J. E. 1979, MNRAS, 186, 779 [NASA ADS] [CrossRef] [Google Scholar]
- Earnshaw, H. M., Roberts, T. P., Heil, L. M., et al. 2016, MNRAS, 456, 3840 [NASA ADS] [CrossRef] [Google Scholar]
- Earnshaw, H. P., Roberts, T. P., & Sathyaprakash, R. 2018, MNRAS, 476, 4272 [NASA ADS] [CrossRef] [Google Scholar]
- Ekşi, K. Y., Andaç, I. C., Çıkıntoğlu, S., et al. 2015, MNRAS, 448, L40 [CrossRef] [Google Scholar]
- Erkut, M. H., Ekşi, K. Y., & Alpar, M. A. 2019, ApJ, 873, 105 [NASA ADS] [CrossRef] [Google Scholar]
- Evans, P. A., Beardmore, A. P., Page, K. L., et al. 2009, MNRAS, 397, 1177 [Google Scholar]
- Fürst, F., Walton, D. J., Harrison, F. A., et al. 2016, ApJ, 831, L14 [Google Scholar]
- Fürst, F., Walton, D. J., Stern, D., et al. 2017, ApJ, 834, 77 [Google Scholar]
- Fürst, F., Walton, D. J., Heida, M., et al. 2021, A&A, 651, A75 [NASA ADS] [CrossRef] [EDP Sciences] [Google Scholar]
- Gao, S.-J., & Li, X.-D. 2021, RAA, 21, 196 [NASA ADS] [Google Scholar]
- Gehrels, N. 1986, ApJ, 303, 336 [Google Scholar]
- Ghosh, P., & Lamb, F. K. 1979a, ApJ, 232, 259 [Google Scholar]
- Ghosh, P., & Lamb, F. K. 1979b, ApJ, 234, 296 [Google Scholar]
- Henrichs, H. F. 1983, in Accretion-Driven Stellar X-ray Sources, eds. W. H. G. Lewin, & E. P. J. van den Heuvel (Cambridge: Cambridge University Press), 393 [Google Scholar]
- Herold, H. 1979, Phys. Rev. D, 19, 2868 [NASA ADS] [CrossRef] [Google Scholar]
- Hou, X., Ge, M. Y., Ji, L., et al. 2022, ApJ, 938, 149 [NASA ADS] [CrossRef] [Google Scholar]
- Houck, J. C., & Denicola, L. A. 2000, ASP Conf. Ser., 9, 591 [NASA ADS] [Google Scholar]
- Ikhsanov, N. R. 2001, A&A, 375, 944 [NASA ADS] [CrossRef] [EDP Sciences] [Google Scholar]
- Ikhsanov, N. R. 2007, MNRAS, 375, 698 [Google Scholar]
- Illarionov, A. F., & Sunyaev, R. A. 1975, A&A, 39, 185 [NASA ADS] [Google Scholar]
- Israel, G. L., Belfiore, A., Stella, L., et al. 2017a, Science, 355, 817 [NASA ADS] [CrossRef] [Google Scholar]
- Israel, G. L., Papitto, A., Esposito, P., et al. 2017b, MNRAS, 466, L48 [NASA ADS] [CrossRef] [Google Scholar]
- Kaaret, P., Feng, H., & Roberts, T. P. 2017, ARA&A, 55, 303 [Google Scholar]
- King, A. R. 2009, MNRAS, 393, L41 [NASA ADS] [Google Scholar]
- King, A., Lasota, J.-P., & Kluźniak, W. 2017, MNRAS, 468, L59 [Google Scholar]
- Kluźniak, W., & Lasota, J.-P. 2015, MNRAS, 448, L43 [CrossRef] [Google Scholar]
- Koliopanos, F., Vasilopoulos, G., Godet, O., et al. 2017, A&A, 608, A47 [NASA ADS] [CrossRef] [EDP Sciences] [Google Scholar]
- Kong, L.-D., Zhang, S., Zhang, S.-N., et al. 2022, ApJ, 933, L3 [NASA ADS] [CrossRef] [Google Scholar]
- Kraft, R. P., Burrows, D. N., & Nousek, J. A. 1991, ApJ, 374, 344 [Google Scholar]
- Leahy, D. A., Elsner, R. F., & Weisskopf, M. C. 1983, ApJ, 272, 256 [Google Scholar]
- Liu, J., Vasilopoulos, G., Ge, M., et al. 2022, MNRAS, 517, 3354 [CrossRef] [Google Scholar]
- Middleton, M. J., & King, A. 2017, MNRAS, 470, L69 [Google Scholar]
- Middleton, M. J., Brightman, M., Pintore, F., et al. 2019, MNRAS, 486, 2 [Google Scholar]
- Motch, C., Pakull, M. W., Soria, R., Grisé, F., & Pietrzyński, G. 2014, Nature, 514, 198 [NASA ADS] [CrossRef] [Google Scholar]
- Mushtukov, A. A., Suleimanov, V. F., Tsygankov, S. S., & Poutanen, J. 2015, MNRAS, 454, 2539 [Google Scholar]
- Mushtukov, A. A., Portegies Zwart, S., Tsygankov, S. S., Nagirner, D. I., & Poutanen, J. 2021, MNRAS, 501, 2424 [NASA ADS] [CrossRef] [Google Scholar]
- Parfrey, K., Spitkovsky, A., & Beloborodov, A. M. 2016, ApJ, 822, 33 [NASA ADS] [CrossRef] [Google Scholar]
- Piconcelli, E., Jimenez-Bailón, E., Guainazzi, M., et al. 2004, MNRAS, 351, 161 [Google Scholar]
- Pintore, F., Zampieri, L., Stella, L., et al. 2017, ApJ, 836, 113 [Google Scholar]
- Quintin, E., Webb, N. A., Gúrpide, A., Bachetti, M., & Fürst, F. 2021, MNRAS, 503, 5485 [NASA ADS] [CrossRef] [Google Scholar]
- Rodríguez Castillo, G. A., Israel, G. L., Belfiore, A., et al. 2020, ApJ, 895, 60 [Google Scholar]
- Sathyaprakash, R., Roberts, T. P., Walton, D. J., et al. 2019, MNRAS, 488, L35 [NASA ADS] [CrossRef] [Google Scholar]
- Shakura, N. I., & Sunyaev, R. A. 1973, A&A, 24, 337 [NASA ADS] [Google Scholar]
- Staubert, R., Trümper, J., Kendziorra, E., et al. 2019, A&A, 622, A61 [NASA ADS] [CrossRef] [EDP Sciences] [Google Scholar]
- Strüder, L., Briel, U., Dennerl, K., et al. 2001, A&A, 365, L18 [Google Scholar]
- Townsend, L. J., Kennea, J. A., Coe, M. J., et al. 2017, MNRAS, 471, 3878 [NASA ADS] [CrossRef] [Google Scholar]
- Tsygankov, S. S., Mushtukov, A. A., Suleimanov, V. F., & Poutanen, J. 2016, MNRAS, 457, 1101 [Google Scholar]
- Tsygankov, S. S., Doroshenko, V., Mushtukov, A. A., Lutovinov, A. A., & Poutanen, J. 2018, MNRAS, 479, L134 [CrossRef] [Google Scholar]
- Tully, R. B., Courtois, H. M., & Sorce, J. G. 2016, AJ, 152, 50 [Google Scholar]
- Turner, M. J. L., Abbey, A., Arnaud, M., et al. 2001, A&A, 365, L27 [CrossRef] [EDP Sciences] [Google Scholar]
- Urpin, V., Konenkov, D., & Geppert, U. 1998, MNRAS, 299, 3 [Google Scholar]
- Vasilopoulos, G., Petropoulou, M., Koliopanos, F., et al. 2019, MNRAS, 488, 5225 [Google Scholar]
- Vasilopoulos, G., Ray, P. S., Gendreau, K. C., et al. 2020, MNRAS, 494, 5350 [NASA ADS] [CrossRef] [Google Scholar]
- Walton, D. J., Harrison, F. A., Bachetti, M., et al. 2015, ApJ, 799, 122 [NASA ADS] [CrossRef] [Google Scholar]
- Walton, D. J., Fürst, F., Bachetti, M., et al. 2016, ApJ, 827, L13 [Google Scholar]
- Walton, D. J., Bachetti, M., Fürst, F., et al. 2018a, ApJ, 857, L3 [Google Scholar]
- Walton, D. J., Brightman, M., Risaliti, G., et al. 2018b, MNRAS, 473, 4377 [Google Scholar]
- Walton, D. J., Fürst, F., Heida, M., et al. 2018c, ApJ, 856, 128 [NASA ADS] [CrossRef] [Google Scholar]
- Wang, Y. M. 1995, ApJ, 449, L153 [NASA ADS] [Google Scholar]
- Wilson-Hodge, C. A., Malacaria, C., Jenke, P. A., et al. 2018, ApJ, 863, 9 [Google Scholar]
All Tables
Details of the XMM-Newton observations of NGC 5907 ULX1 considered in this work.
Implied magnetic field strength for three different epochs following the method given by Gao & Li (2021).
Summary of magnetic field estimations with the different methods presented in this work.
All Figures
|
Fig. 1. Flux and period evolution of NGC 5907 ULX1 between 2014 and 2022. Top: Swift/XRT light curve (0.3–10.0 keV). In green the upper limit for the point source luminosity as measured with Chandra (Belfiore et al. 2020) is shown, using the right y-axis. The XMM-Newton luminosities are shown as red diamonds and orange squares for observations with and without detect pulsations, respectively, also using the right-hand y-axis. The horizontal green line indicates the estimated propeller luminosity based on a magnetic field strength of B = 2.6 × 10¹³ G (see Table 3). The blue curve shows an extrapolation of the 78 d X-ray period seen from NGC 5907 ULX1 during its ULX state (Walton et al. 2016). The shaded pink areas indicate where the source was conceivably in the low state and spinning down. Bottom: pulse period measurements, as listed in Table 1 and Israel et al. (2017a). The gray vertical dotted lines indicate times of observations with XMM-Newton. The blue dashed line shows a possible fiducial model of epochs of spin-up during bright states interspersed with spin-down during off-states. This line is only a suggestion for the evolution of the period. For details see text. |
| In the text | |
Current usage metrics show cumulative count of Article Views (full-text article views including HTML views, PDF and ePub downloads, according to the available data) and Abstracts Views on Vision4Press platform.
Data correspond to usage on the plateform after 2015. The current usage metrics is available 48-96 hours after online publication and is updated daily on week days.
Initial download of the metrics may take a while.