Fig. 1.
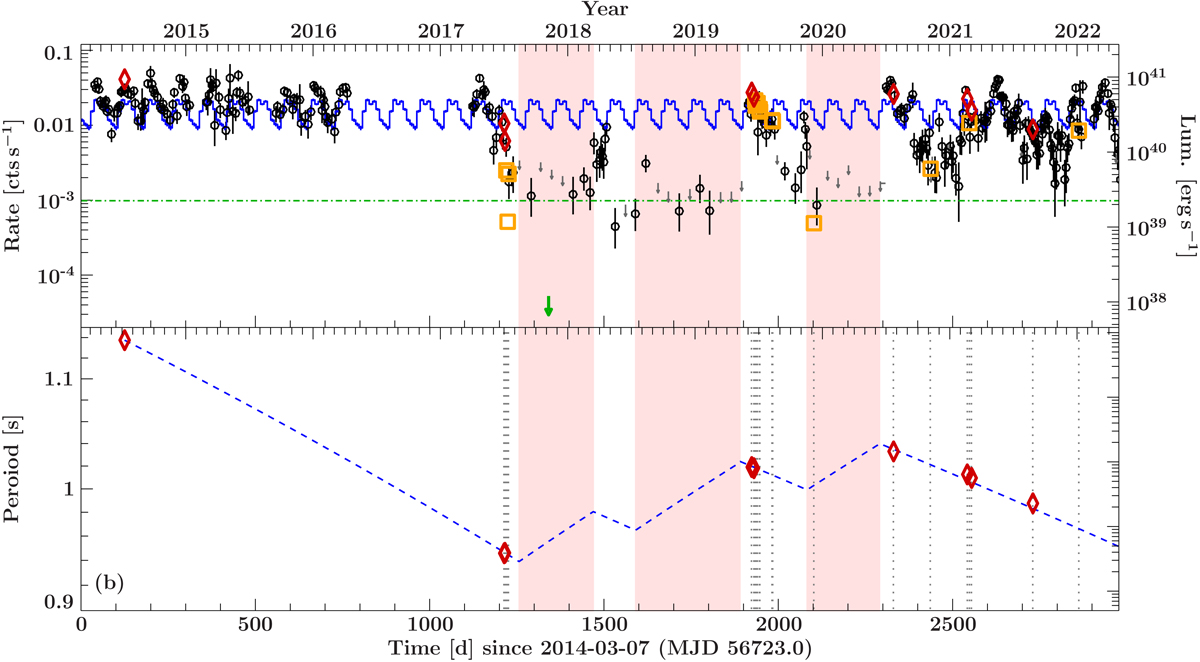
Download original image
Flux and period evolution of NGC 5907 ULX1 between 2014 and 2022. Top: Swift/XRT light curve (0.3–10.0 keV). In green the upper limit for the point source luminosity as measured with Chandra (Belfiore et al. 2020) is shown, using the right y-axis. The XMM-Newton luminosities are shown as red diamonds and orange squares for observations with and without detect pulsations, respectively, also using the right-hand y-axis. The horizontal green line indicates the estimated propeller luminosity based on a magnetic field strength of B = 2.6 × 10¹³ G (see Table 3). The blue curve shows an extrapolation of the 78 d X-ray period seen from NGC 5907 ULX1 during its ULX state (Walton et al. 2016). The shaded pink areas indicate where the source was conceivably in the low state and spinning down. Bottom: pulse period measurements, as listed in Table 1 and Israel et al. (2017a). The gray vertical dotted lines indicate times of observations with XMM-Newton. The blue dashed line shows a possible fiducial model of epochs of spin-up during bright states interspersed with spin-down during off-states. This line is only a suggestion for the evolution of the period. For details see text.
Current usage metrics show cumulative count of Article Views (full-text article views including HTML views, PDF and ePub downloads, according to the available data) and Abstracts Views on Vision4Press platform.
Data correspond to usage on the plateform after 2015. The current usage metrics is available 48-96 hours after online publication and is updated daily on week days.
Initial download of the metrics may take a while.