Open Access
Fig. 5.
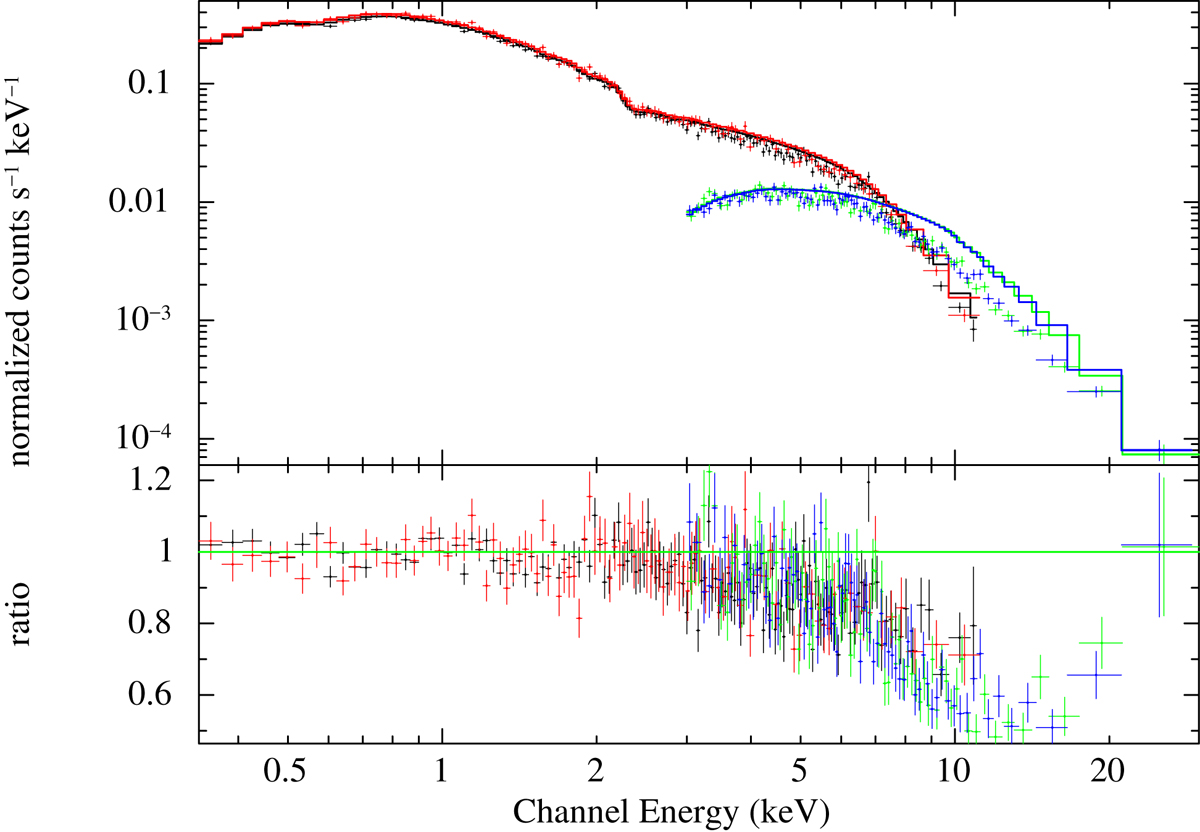
Phase-averaged broadband (XMM-Newton plus NuSTAR) X-ray spectrum of NGC 300 ULX1 (upper panel) plotted together with the data-to-model ratio for the absorbed AC model (lower panel). For illustration purposes the strength of the absorption line has been set to zero.
Current usage metrics show cumulative count of Article Views (full-text article views including HTML views, PDF and ePub downloads, according to the available data) and Abstracts Views on Vision4Press platform.
Data correspond to usage on the plateform after 2015. The current usage metrics is available 48-96 hours after online publication and is updated daily on week days.
Initial download of the metrics may take a while.