| Issue |
A&A
Volume 621, January 2019
Gaia Data Release 2
|
|
|---|---|---|
| Article Number | A144 | |
| Number of page(s) | 20 | |
| Section | Catalogs and data | |
| DOI | https://doi.org/10.1051/0004-6361/201834142 | |
| Published online | 23 January 2019 | |
Gaia Data Release 2
Cross-match with external catalogues: algorithms and results
1
INAF – Osservatorio Astronomico di Roma,
Via Frascati 33,
00078,
Monte Porzio Catone (Roma),
Italy
e-mail: This email address is being protected from spambots. You need JavaScript enabled to view it.
2
Space Science Data Center – ASI,
Via del Politecnico SNC,
00133
Roma,
Italy
Received:
27
August
2018
Accepted:
16
November
2018
Abstract
Context. Although the Gaia catalogue on its own is a very powerful tool, it is the combination of this high-accuracy archive with other archives that will truly open up amazing possibilities for astronomical research. The advanced interoperation of archives is based on cross-matching, leaving the user with the feeling of working with one single data archive. The data retrieval should work not only across data archives but also across wavelength domains. The first step for a seamless access to the data is the computation of the cross-match between Gaia and external surveys.
Aims. We describe the adopted algorithms and results of the pre-computed cross-match of the Gaia Data Release 2 (DR2) catalogue with dense surveys (Pan-STARRS1 DR1, 2MASS, SDSS DR9, GSC 2.3, URAT-1, allWISE, PPMXL, and APASS DR9) and sparse catalogues (HIPPARCOS2, Tycho-2, and RAVE 5).
Methods. A new algorithm is developed specifically for sparse catalogues. Improvements and changes with respect to the algorithm adopted for DR1 are described in detail.
Results. The outputs of the cross-match are part of the official Gaia DR2 catalogue. The global analysis of the cross-match results is also presented.
Key words: astronomical databases: miscellaneous / catalogs / surveys / astrometry / proper motions
© ESO 2019
1 Introduction
The Gaia satellite allows determining high-accuracy positions for ~1.7 billion sources and parallaxes and proper motions for ~1.3 billion sources observed all-sky down to magnitude G ~ 20.7. Compared to the first intermediate Gaia Data Release (DR1, see Gaia Collaboration 2016a for a summary of the astrometric, photometric, and survey properties, and Gaia Collaboration 2016b for the scientific goals of the mission), the second intermediate Gaia Data Release (Gaia Collaboration 2018a) provides 48% additional sources, parallaxes, and proper motions with an unprecedented accuracy for 77% of all observed sources, which are complemented by a precise and homogeneous multi-band photometry and a large radial velocity survey for more than 7 000 000 sources with G magnitude in the 4–13 range. Astrophysical parameters for ~160 million sources, data on more than 500 000 variable stars, and ~14 000 solar system objects are also available in DR21.
The main goal of adding a pre-computed cross-match to Gaia DR2 data is complementing Gaia with existing astrophysical quantities (that are widely used by the scientific community). This allows the full exploitation of the scientific potential of Gaia.
The general principles of the adopted cross-match algorithm are given and discussed in Marrese et al. 2017 (hereafter Paper I). We here briefly recall that any cross-match algorithm is a trade-off between multiple requisites, and a fraction of mismatched and/or missed objects is always present. Our aim is to define and implement a cross-match algorithm that on one hand should be general enough to be exploited for different scientific cases, and on the other should have complete results that can later be filtered to better fullfil a specific scientific problem. We tried to find a reasonable compromise between the completeness and correctness requirements, which implies that we needed to avoid adding too many spurious matches.
In Sects. 2 and 3 we describe the general principle and the details of the cross-match algorithms defined for Gaia DR2, respectively. Section 4 contains the list of the external catalogues that we matched with Gaia DR2 data and a short description for the newly added catalogues, together with some issues or caveats that are relevant to the cross-match. In Sects. 5 and 6 we describe and discuss the cross-match output content and the results. Finally, Appendix A contains a discussion of the effective angular resolution of external catalogues and its influence on the cross-match.
2 Gaia pre-computed cross-match: general principles
Following the same approach as in Paper I, we define the cross-match algorithm according to the scientific problem we are faced with. Since the cross-match results with external catalogues are part of the official Gaia DR2 and are integrated in the Gaia catalogue access environments, it is fundamental to match Gaia with each external survey separately and independently, in a consistent and homogeneous manner. We therefore created links between different surveys through the Gaia catalogue, which is all-sky and has the highest angular resolution. Gaia is thus at the centre of our cross-match schema, as depicted in Fig. 1. For multi-catalogue searches, the catalogue specific matches to Gaia that are common to different surveys can be selected using multiple joins.
The external catalogues to be matched with Gaia DR2 are all obtained in the optical/near-IR wavelength region (with the exception ofallWISE, which extends in the medium-IR domain), are general surveys not restricted to a specific class of objects, and have an angular resolution lower than Gaia, as was the case for Gaia DR1. However, in contrast to the case of the cross-match of Gaia DR1, the external catalogues to be matched with Gaia DR2 are not sufficiently homogeneous among themselves for the exact same algorithm to be used for all of them. We therefore broadly separated the external catalogues into two different groups: large dense surveys, and sparse catalogues, and we defined two slightly different algorithms for the two groups. External catalogues are here defined as dense surveys when it is possible to define a precise (i.e. based on a reasonable number of objects) and accurate (i.e. local) density around the majority of their objects. The two algorithms we define are not symmetric, and for the dense surveys, we use Gaia as the leading catalogue, while for sparse catalogues, we use Gaia as the second catalogue.
The cross-match algorithms we use in DR2 are quite similar to the algorithm that was successfully used in DR1, however we could take advantage of the enormous increase in the number of sources with proper motions and parallaxes with respect to Gaia DR1, and we ameliorated the algorithm in many respects: (a) use of the full five-parameter covariance matrix, (b) improved density definition, (c) source-by-source definition of the initial search radius, which allows matching high proper motion stars, and (d) definition of the proper motion threshold tobe used for Gaia sources with no proper motions based on a trade-off between completeness and correctness.
Similarly to what was done for DR1, in the Gaia DR2 cross-match algorithms, we have not defined any special treatment for binary stars so far. The binary stars that may represent a problem for the cross-match are physically related sources with an additional motion that is due to multiplicity, which can displace their positions enough to prevent them from matching. As a general principle, when we knew of an effect that influences astrometry (and thus the cross-match results) but there was no indication in Gaia data how strongly this would affect a specific source, we added a systematic to all affected sources, as we did when we broadened the position errors of Gaia sources without proper motions (see Sect. 2.1). However, when an effect influences the astrometry of a specific subsample of sources (such as binaries), but there is no information on which sources and how strong the influence is in the Gaia data, we assumed a more cautious attitude and only added a caveat stating that the effect was not taken into account.
We repeat here some basic definitions that are still valid in DR2, but can also be found in Paper I. A good neighbour for a given object in the leading catalogue is a nearby object in the second catalogue whose position is compatible within position errors with the target. We assume that when a good neighbour is found, it is the counterpart. When more than one good neighbour is found, the best neighbour (i.e. the most probable counterpart according to the figure of merit we define, see Sect. 3) is chosen among the good neighbours. Also for Gaia DR2, we produced two separate cross-match outputs: a BestNeighbour table, which lists the leading catalogue matched objects with their best neighbour, and a Neighbourhood table, which includes all good neighbours for each matched object (see Sect. 5 for a detailed output description).
For dense surveys, the higher angular resolution of Gaia requires a many-to-one algorithm: therefore the algorithm we used is not symmetric and more than one Gaia object can have the same best neighbour in a given dense survey. Two or more Gaia objects with the same best neighbour are called mates. True mates are objects that are resolved by Gaia, but are not resolved by the external survey. For sparse catalogues (such as HIPPARCOS2, Tycho-2, and RAVE 5), where the external catalogue is the leading catalogue, a one-to-one match is forced and mates are not allowed. Additional good neighbours in Gaia for each sparse catalogue source can be found in the Neighbourhood output table.
The cross-match algorithms used for Gaia DR2 are positional and evaluate the second catalogue environment, like for DR1. However, for DR2, we exploit the full five-parameters covariance matrix calculated for the Gaia astrometric solution (Lindegren et al. 2018, Gaia Collaboration 2018b) when it is available (i.e. 77% of sources).
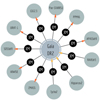 |
Fig. 1 Gaia DR2 cross-match schema: for large dense surveys (orange arrows), Gaia is the leading catalogue, while for sparse catalogues (yellow arrows), the external catalogue leads. |
2.1 Accounting for epoch differences
Cross-match algorithms are based on the comparison of source positions in different surveys. Surveys have been obtained at different epochs, which can be decades apart, and sources often move appreciably in the meantime, therefore it is important to take the source motion into account.
In order to do so, we moved the Gaia objects to the individual epoch of the possible matches in the external catalogues using the algorithm provided in the HIPPARCOS and Tycho Catalogue documentation (ESA 1997). While this algorithm requires the use of all six parameters, α (Right Ascension), δ (Declination), π (parallax), μα* (proper motion in αcosδ), μδ (proper motion in δ), and VR (radial velocity), VR is not included in the published astrometric solution in Gaia DR2. Nonetheless, according to Lindegren et al. (2018), and in particular their Sect. 3, VR is relevant only for very few sources (53).
For the fraction of Gaia sources for which only a position (i.e. 2 parameters) astrometric solution is available, we applied the broadening method described in Paper I for the sake of completeness. We thus defined a proper motion threshold that is common to all sources and all external catalogues for homogeneity and consistency reasons. In DR1, the adopted threshold (200 mas yr−1) was chosen by evaluating the distribution of known high proper motion stars. Instead, while we are aware that the peak of the total proper motion distribution for Gaia sources is ~6 mas yr−1, and with the aim of also recovering high proper motion stars in the subsample of Gaia sources with two-parameter astrometric solutions, we decided for DR2 to derive from the data which was the most appropriate proper motion threshold to use. We therefore considered the subsample of Gaia sources with a five-parameter astrometric solution, and we compared the cross-match results obtained using the position propagation method on one hand and the broadening method on the other. In this evaluation, we assumed (a) that the subsample of Gaia sources without available proper motions has the same proper motion distribution as the subsample with measured proper motions, and (b) that the result obtained using the position propagation is correct. We conducted different tests with the broadening method in order to determine a proper motion threshold that allowed maximising the number of correctly recovered matches and minimising the addition of spurious matches. The tests were performed on all catalogues using different thresholds. The number of sources recovered in the cross-match output for a given external catalogue depends on the combination of the typical epoch difference between the external catalogue and Gaia DR2 and the typical size of the position errors of the external catalogue. The larger the epoch difference and the smaller the position errors, the larger the number of recovered sources and thus the more relevant the position error broadening. On the other hand, the denser the external catalogue, the larger the number of added spurious matches.
Table 1 and Fig. 2 illustrate the method we used and show the comparison of the cross-match results for 2MASS PSC and GSC 2.3 between the position propagation method, the broadening method with the adopted 50 mas yr−1 threshold, and the method without position propagation (i.e. broadening threshold 0 mas yr−1). In order to describe how the position error broadening method works, we chose two catalogues: 2MASS, for which the method gives a good improvement in the number of matched sources, and GSC 2.3, for which the improvement is less relevant. In the case of 2MASS, the typical epoch difference is ~15 yr, which combined with a typical Gaia total proper motion of 6 mas yr−1, implies a ~0.09 arcsec displacement. This displacement must be compared with the 2MASS position errors, which for most of the sources, are smaller than 0.1 arcsec. In the case of GSC 2.3, instead, the typical epoch difference with Gaia is ~25 yr, which implies a displacement due to proper motions of about 0.15 arcsec. This displacement is small compared with the 0.3−0.4 arcsec values of the typical GSC 2.3 position errors.
Therefore, the adopted proper motion threshold for DR2 is 50 mas yr−1. This is our best compromise between completeness and the quantity of spurious matches added to the cross-match.
Comparison of the correct best matches obtained with the broadening method using two different proper motion thresholds (and the proper motion propagation of positions method as baseline).
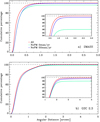 |
Fig. 2 Cumulative distribution of the angular distance of correct best matches obtained with the broadening method using two different proper motion thresholds (50 and 0 mas yr−1) when compared to the proper motion propagation of positions method (red curve indicated by All label). |
2.2 Environment
As discussed in Paper I, the cross-match is not only a source-to-source but also a local problem, thus the figure of merit used to evaluate the good neighbours and to choose the best neighbour among them should also take into account the local surface density of the second catalogue. The density is thus included in the adopted figure of merit (FoM, see Sect. 3.4), and its precision (which depends on the number of sources used to obtain it) has an important influence on the FoM precision. Ideally, ~100 sources are required to evaluate the FoM with a good precision, while ~30 sources are still acceptable. The radius needed to obtain the minimum number of sources is instead a measure of the accuracy of the density and consequently of the FoM. A more local determination is indeed more accurate, especially in dense fields, where there are density variations on small scales and where the FoM is more important as it is used to select the best neighbour among an higher number of good neighbours.
For Gaia DR2, the local density was pre-calculated around each second catalogue source and was fed to the cross-match algorithm. We used a K-nearest method that aims to determine the radius at which the 100th nearby source is found. We also set a maximum radius to search for nearby sources that depends on the catalogue number of sources weighted by its sky coverage. The reason we defined a maximum radius is that we consider an accurate (i.e. local) density more important than a precise density, but computation performances were also taken into account. When the algorithm reached the maximum radius threshold, the corresponding star number was used to calculate the density, even if it was lower than 100. Table 2 allows determining for each catalogue, including Gaia, the fraction of sources with a sub-optimal density determination.
The density determination is improved for DR2 with respect to DR1. However, it is a compromise just like many other details of the cross-match algorithm described in this paper, specifically, a compromise between accuracy and precision.
3 Gaia pre-computed cross-match: details
We recall here the basic details of the cross-match algorithm and outline the differences with DR1. As described in Paper I, the cross-match algorithm uses a plane-sweep technique that requires the catalogues to be sorted by declination, implies the definition of an active list of objects in the second catalogue for each leading catalogue object, and allows reading the input data only once, which speeds up the cross-match computation (Devereux et al. 2004, 2005, Abel et al. 2004, Power & Devereux 2004). We used the same filter and refine technique as in DR1, but the first filter is now defined on an object-by-object basis (i.e. it is different for each target within a given leading catalogue), rather than being fixed for a given pair of leading and second catalogues, and it is only used to select candidate good neighbours and not to calculate the density on-the-fly. The second filter is used to select good neighbours among the candidates. The selection of the best neighbour among good neighbours is based on the same FoM as described in Paper I. A normal distribution for position errors is still assumed, and the position error ellipses are projected on the tangent plane.
3.1 Initial search radius (first filter)
In the following, subscript L stands for leading catalogue and subscript S stands for second catalogue. The definition of the initial search radius (RI) depends on the position in the cross-match algorithm of the Gaia catalogue as leading (i.e. dense surveys cross-match) or second catalogue (i.e. sparse catalogues cross-match).
RI is computed around each leading catalogue object as
 (1)
(1)
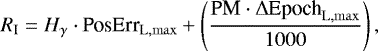
where Hγ = 5 corresponds to a confidence level γ of 0.9999994267; PosErrL,max is the combined position error for each L source with the maximum position error in the S catalogue; Δ EpochL,max is the maximum reference epoch difference between the L source and the S catalogue; and PM is the proper motion considered. The definition of PM is different in different cases:
proper motion of the L source if Gaia is the leading catalogue and the L source has a five-parameter astrometric solution;
proper motion threshold if Gaia is the leading catalogue and the L source has a two-parameter astrometric solution;
maximum of the Gaia catalogue proper motions if Gaia is the second catalogue.
The combined position error PosErrL,max is now defined as
![Mathematical equation: \begin{eqnarray*} \textrm{PosErr}_{\textrm{L,max}} &=&\textrm{max}\,[ {\textrm{RAerr}_{\textrm{L}},\textrm{DECerr}_{\textrm{L}}}]\nonumber\\ && +\,\textrm{max}\,[ \textrm{max}\,(\textrm{RAerr}_{\textrm{S}}),\textrm{max}\, (\textrm{DECerr}_{\textrm{S}}) ], \end{eqnarray*}](/articles/aa/full_html/2019/01/aa34142-18/aa34142-18-eq2.png) (2)
(2)
where RAerr and DECerr are the uncertainties in Right Ascension and Declination. The maximum epoch difference between the L source and the S catalogue being matched is defined as
![Mathematical equation: \begin{eqnarray*} &&{\Delta} \textrm{Epoch}_{\textrm{L,max}} = \nonumber\\ &&\quad {\textrm{max}}\, \Big[~|\textrm{max}\,(\textrm{refEpoch}_{\textrm{L}})-\textrm{min}\,(\textrm{refEpoch}_{\textrm{S}})|,~\\ &&\quad\ |\textrm{min}\,(\textrm{refEpoch}_{\textrm{L}})-\textrm{max}\,(\textrm{refEpoch}_{\textrm{S}})|~ \Big].\nonumber \end{eqnarray*}](/articles/aa/full_html/2019/01/aa34142-18/aa34142-18-eq3.png) (3)
(3)
In the above equations, RI is in arcsec, PosErrL,max in arcsec, PM is in mas yr−1, and refEpoch is in years.
3.2 Broadening of position errors
While a detailed discussion of the broadening method is available in Paper I, we repeat here for clarity the equations defining the position error broadening:
![Mathematical equation: \begin{eqnarray*} &\sigma_{x_{G'}} = \sigma_{x_{G}} + \textrm{SysErr}_{x} = \sigma_{x_{G}} + \textrm{PM} \cdot {\Delta} \textrm{Epoch}/5,\nonumber \\[-5pt] \\[-5pt] &\sigma_{y_{G'}} = \sigma_{y_{G}} + \textrm{SysErr}_{y} = \sigma_{y_{G}} + \textrm{PM} \cdot {\Delta} \textrm{Epoch/}5,\nonumber \end{eqnarray*}](/articles/aa/full_html/2019/01/aa34142-18/aa34142-18-eq4.png) (4)
(4)
where G stands for Gaia. In DR2 we always broadened the Gaia position errors when a five-parameter astrometric solution was not available, regardless of whether Gaia was the leading or second catalogue.
3.3 Good neighbour selection (second filter)
In order to define the second filter, it was necessary to convolve the leading and second catalogue position errors. We refer to Pineau et al. (2011) and to Paper I for a detailed definition and derivation of the position error convolution ellipse.
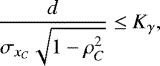
The second filter is based on the Mahalanobis normalised distance Kγ (see Eq. (9) in Paper I).  has a χ2 distribution with two degrees of freedom, and its adopted value corresponds to a value of the confidence level γ of 0.9999994267, which in 1D is equivalent to 5σ. Good neighbours are defined as neighbours that fall within the ellipse defined by the confidence level γ. The second filter is thus defined as
 (5)
(5)
where d is the angular distance,  is the convolution ellipse error in the direction from the leading catalogue object to the possible counterpart, and ρC is the correlation between
  and
and  . The high-confidence level was chosen in order to improve the completeness of the cross-match.
3.4 Best neighbour selection: figure of merit
The FoM we used to select the best neighbour among the good neighbours evaluates the ratio between two opposite models/hypotheses: the counterpart candidate is a match or it is found by chance. The FoM depends on the angular distance and the position errors, on the epoch difference, and on the local surface density of the second catalogue. For each of the good neighbours, we computed the FoM and the derived score, described in detail in Paper I. The score is listed in the Neighbourhood output table. The best neighbour is defined as the good neighbour with the highest score value.
4 External catalogue characteristics
Following is the list of external catalogues that were cross-matched with the Gaia DR2 catalogue and had already been matched with DR1:
GSC 2.3 (Lasker et al. 2008)
PPMXL (Röser et al. 2008; Roeser et al. 2010)
SDSS DR9 primary objects (Ahn et al. 2012; Alam et al. 2015)
URAT-1 (Zacharias et al. 2015)
2MASS PSC (Skrutskie et al. 2006)
allWISE (Wright et al. 2010; Cutri et al. 2013)
Following is the list of the new external catalogues that were cross-matched with Gaia DR2:
-
Pan-STARRS1 DR1 (Chambers et al. 2016; Magnier et al. 2016a,b,c; Waters et al. 2016; Flewelling et al. 2016)
-
APASS DR9 (Henden et al. 2016)
-
HIPPARCOS2 (ESA 1997; van Leeuwen 2007)
-
Tycho-2 (ESA 1997; Høg et al. 2000)
-
RAVE 5 (Kunder et al. 2017; Casey et al. 2017)
The main properties to consider when matching the external catalogues with Gaia are (a) the effective angular resolution, (b) the astrometric accuracy, (c) the celestial reference frame, either HCRF2 or Gaia-CRF2 (Gaia Collaboration 2018b), (d) how the catalogue is tied to the International Celestial Reference System (ICRS), (e) the coordinate epochs, (f) the need of propagating astrometric errors when the catalogue proper motions are available and positions are given at epoch J2000.0, but errors on positions are given at mean epoch, and (g) the known issues and caveats. It is also important to take into account how the external catalogue properties compare to the corresponding Gaia catalogue properties.
Table 3 lists the Gaia DR2 and external catalogues properties relevant to the cross-match. The effective angular resolution values reported in Table 3 were derived from the external catalogue reference papers or their on-line documentation. In some cases, the authors directly report the value of the effective angular resolution, in others, they list related quantities such as seeing, pixel scale, and the full width at half maximum of the point spread function (PSF FWHM), which can be used to derive the effective angular resolution. In Sect. 6.1 we describe the effects of the difference in effective angular resolution. Appendix A compares the effective angular resolution values reported in Table 3 with the actual content of the external catalogues. In some cases, the fraction of suspected duplicates is relevant. Figures A.1 and A.2 are useful to understand some details of the cross-match results (see Sect. 6).
Figure 3 shows the sky coverage and the surface density distribution for Gaia DR2 and the external catalogues that are newly matched with Gaia. The corresponding figures for the external catalogues that had been matched before with Gaia DR1 can be found in Paper I. The surface density is calculated by counting the number of sources in each pixel obtained using a HEALPix tessellation: for dense surveys, we adopted a resolution of Nside = 28, which has 786 432 pixels with a constant area of Ω ~188.89 arcmin2, while for sparse catalogues, we adopted a resolution of Nside = 26, which has 49 152 pixels with a constant area of Ω ~ 0.8 degree 2.
The external catalogue quantities used by the cross-match computations described in this study are positions, position errors, position error correlation (if available), and coordinate epochs. Different surveys may have a different definition of some of these quantities and/or use different units. The external catalogue input quantities were thus homogenised in order to simplify the cross-match calculations.
In the following we briefly describe the newly added external catalogues together with some caveats and known issues that are relevant for the cross-match computations. For catalogues that had been cross-matched with DR1, we describe some issues that were not apparent in DR1, but are relevant for the DR2 cross-match.
Properties of Gaia DR2 and external catalogues.
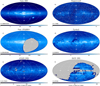 |
Fig. 3 Surface density distribution for Gaia DR2 and the new external catalogues (see Sect. 4) obtained using a HEALPix (Hierarchical Equal Area isoLatitude Pixelization, Górski et al. 2005) tessellation with resolution Nside = 28 for dense surveys and Nside = 26 for sparse catalogues. In grey we indicate areas that are not covered by the survey. The surface density distribution of external catalogues that were also matched with Gaia DR1 can be found in Paper I. |
4.1 Pan-STARRS1 DR1
The Panoramic Survey Telescope and Rapid Response System (Pan-STARRS) is a system for wide-field astronomical imaging developed and operated by the Institute for Astronomy at the University of Hawaii. Pan-STARRS1 (PS1) is the first part of Pan-STARRS to be completed and is the basis for Data Release 1 (DR1). The PS1 survey used a 1.8 m telescope and its 1.4 gigapixel camera to image the sky in five broadband filters (g, r, i, z, y). The version of the catalogue we used for cross-match computation is a filtered subsample of the 10 723 304 629 entries that are listed in the original ObjectThin table.
We used only ObjectThin and MeanObject3 tables to extract what we needed. This means that objects that are detected only in stack images are not included. The main reason for avoiding objects detected in stack images (for cross-match purposes) is that their astrometry is not as good as the mean object astrometry, as stated in the Pan-STARRS1 DR1 documentation: “The stack positions (raStack, decStack) have considerably larger systematic astrometric errors than the mean epoch positions (raMean, decMean)”. The astrometry for the MeanObject positions uses Gaia DR1 as a reference catalogue, while the stack positions use 2MASS as a reference catalogue.
In detail, we filtered out all objects where
nDetections = 1;
no good-quality data in Pan-STARRS, objInfoFlag 33554432 not set;
mean astrometry could not be measured, objInfoFlag 524288 set;
stack position used for mean astrometry, objInfoFlag 1048576 set;
error on all magnitudes equal to 0 or to −999;
all magnitudes set to −999;
error on RA or Dec greater than 1 arcsec.
The number of objects in the Pan-STARRS1 DR1 version used for cross-match is 2 264 263 282.
4.2 APASS DR9
The AAVSO Photometric All Sky Survey (APASS) is obtained in five photometric bands: B, V, g′, r′ and i′, and the observed targets cover the magnitude range 10 < V < 17. APASS data are obtained with dual bore-sighted 20 cm telescopes, designed to obtain two bandpasses of information simultaneously, from two sites near Weed, New Mexico, in the Northern Hemisphere and at CTIO in the Southern Hemisphere. The APASS DR9 contains approximately 62 million stars covering about 99% of the sky. The APASS project is being completed and DR9 is not a final release. According to the APASS documentation, there are some issues in the catalogue that should be taken into account when cross-matching it:
the APASS team does not provide star IDs until the final product and suggests that stars are identified by their RA and Dec;
there are a number of duplicate entries. These appear to be caused by the merging process, where poor astrometry in one field may cause two seed centroids to form for a single object;
there are a number of entries with 0.000 errors;
centroiding in crowded fields is very poor; blends cause photometric as well as astrometric errors;
there are saturated stars in the catalogue, and the APASS team suggests to avoid using sources brighter than V = 7.
The issues described above are reflected in the quality of the cross-match results.
Given the lack of an identifier provided by authors, and because the Vizier TAP service4 is the only available resource for bulk download, we used the CDS recno as identifier, although we are aware that the record number assigned by the VizieR team should not normally be used for identification.
4.3 RAVE 5
The RAdial Velocity Experiment (RAVE) is a multi-fiber spectroscopic astronomical survey of stars in the Milky Way using the 1.2 m UK SchmidtTelescope of the Australian Astronomical Observatory (AAO). RAVE contains multiple observations of the same source, which are identified with the same RAVEID and a different RAVE_OBS_ID. The number of entries in the catalogue is 520 701, while the number of distinct sources is 457 555. For cross-match calculations we used the distinct sources.
4.4 HIPPARCOS 2
HIPPARCOS2 is a new improved reduction of the astrometric data produced by the HIPPARCOS mission. The astrometric accuracies are much better (up to a factor of 4) than in the original catalogue.
4.5 Tycho-2
The Tycho-2 catalogue is an astrometric reference catalogue containing positions, proper motions, and two-colour photometric data for the 2.5 million brightest stars in the sky. The Tycho-2 positions and magnitudes are based on precisely the same observations as the original Tycho catalogue collected by the star mapper of the ESA HIPPARCOS satellite, but Tycho-2 is much larger and slightly more precise, owing to a more advanced reduction technique. Components of double stars with separations down to 0.8 arcsec are included.
There are 109 445 sources in Tycho-2 without an astrometric solution. These objects are indicated by pFlag = X, where pFlag is the mean position flag. For these objects we used the observed Tycho-2 values for coordinates, coordinate errors, and reference epoch.
There are 13 098 sources in Tycho-2 for which pFlag = P. These objects are binaries (actually for 82 of them one of the two components is missing in the sample flagged with pFlag = P) and have different source Ids, but identical astrometry since the photocentre is used for the astrometric solution, which includes proper motions.
4.6 SDSS DR9
A detailed description of the astrometric SDSS calibration is given in Pier et al. (2003), and a summary is provided in the online documentation5. The r photometric CCDs serve as the astrometric reference CCDs for the SDSS. That is, the positions for SDSS objects are based on the r centroids and calibrations. The r CCDs are calibrated by matching bright stars detected by SDSS with the UCAC astrometric reference catalogues. The SDSS collaboration implemented an astrometry quality assurance (QA) system in order to identify errors in the SDSS imaging astrometry and provided a summary file6 containing all information about the SDSS field astrometry QA, including offsets from each of the reference catalogues. The astrometry QA summary file is available for download7. The methodwe used to include the results of the above analysis in the cross-match algorithm is described in Sect. 6.
5 Cross-match output
The cross-match output consists of two separate tables: BestNeighbour includes the best matches (selected as the good neighbour with the highest value of the score), while Neighbourhood includes all the good neighbours (selected using the second filter, see Eq. (5)). The cross-match output datamodels are described in Tables 4 and 5. The content and some statistics of the BestNeighbour and Neighbourhood output tables for each external catalogue are summarised in Tables 6 and 7.
BestNeighbour output table content.
Neighbourhood output table content.
6 Results
The cross-match results are part of the official Gaia DR2 release and are available at the ESA Gaia Archive8 and at Partner Data Centres Archives9. The cross-match results are described in Table 8 and in Figs. 4–6.
Given the size of the catalogues involved in this cross-match study, the analysis of the results can be performed only on general grounds, certainly not on an object-by-object basis. The aim of the following analysis is thus to give users information on the global characteristics of the cross-match results for a given catalogue, that is, sky and magnitude distributions of matched sources, distribution of angular distance of matched pairs, and fraction of matched sources.
In particular, the surface density maps displayed in the left column of Fig. 4 show the fraction of matched Gaia sources, while the maps in the right column show the fraction of matched external catalogue sources. These maps, combined with the corresponding maps available in Fig. 3 or in Paper I, allow the spatial analysis of the cross-match results. In the case of GSC 2.3 and PPMXL, the cross-match with the duplicated sources located at the plate borders results in an over-density of matched Gaia sources that is clearly visible in Fig. 4 as a square pattern.
The histograms in Fig. 5 show the magnitude distribution of the matched external catalogue sources compared with the distribution of the full catalogue. Figure 5 can thus be used to assess the fraction of matched and missed external catalogue sources as a function of magnitude.
The angular distance distributions shown of cross-matched pairs in Fig. 6 can be used to evaluate the global agreement of the external catalogue astrometry with Gaia. They can be used to retrieve information about the angular distance at which the bulk of the matchedpairs are found (blue histograms) and about the angular distance within which all the matched sources are found (cumulative red curves). In addition, they also show no indication of the Poisson tail that is always present in cone search results: one of the advantages of a cross-match over a cone search is indeed that the search radius is defined on a pair-by-pair basis and is not fixed for all pairs. For example, even if in Figs. 4 and 5 APASS DR9 and 2MASS cross-match results show similar behaviours, it is instead clear from Fig. 6 that the 2MASS positions are in much better agreement with Gaia than the APASS DR9 positions. It is important to note that the histograms in Fig. 6 are not a direct indication of the astromentric quality of the external catalogues. The main reason is that the histograms show only the matched sources, while astrometric issues in a catalogue often prevent the match of a fraction of the potential counterparts, leaving only the sources with good astrometry. In this study, by “good astrometry” we mean not only accurate positions, but also a careful evaluation of the position errors and the inclusion of systematics in position errors. The cross-match algorithms that require counterparts to be compatible within position errors easily highlight when position errors are underestimated. In the following we illustrate and discuss some specific features and characteristics of the cross-match results.
BestNeighbour statistics: max values of relevant output fields in BestNeighbour tables.
Neighbourhood statistics: min/max values of relevant output fields in Neighbourhood tables.
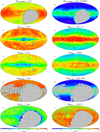 |
Fig. 4 Surface density map for matched sources obtained using a HEALPix tessellation with resolution Nside = 28 for dense surveys. Left column: fraction of Gaia sources that match with an external catalogue. Right column: fraction of distinct external catalogue sources that match with Gaia. |
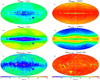 |
Fig. 4 continued. |
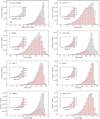 |
Fig. 5 Magnitude distribution in the most populated band for the sources in the external catalogues. In grey we plot the catalogue distribution and in red the matched source distribution. |
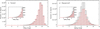 |
Fig. 5 continued. |
6.1 Effect of effective angular resolution differences on XM results
The comparison between the effective angular resolution of Gaia and of the external catalogues is very important for the cross-match. The higher Gaia angular resolution (which will improve with the forthcoming releases) implies that Gaia will frequently resolve sources that are unresolved in the external catalogue. The larger the difference in effective resolution between Gaia and the external catalogue, the more common the resolved objects. For this reason, since Gaia DR1 we chose a many-to-one algorithm for dense surveys and defined the mates, which are two or more Gaia sources with the same best neighbour in the external catalogue. The external catalogue sources that are the counterpart of two or more Gaia sources are thus very likely sources that are resolved in Gaia. The chances that mates correspond to a resolved object are obviously higher when all mates have proper motions available, and thus their positions are reliably propagated to the external catalogue epoch. A more subtle effect arises when the photocentre of the unresolved external catalogue source is too far from the corresponding two or more Gaia counterparts to allow a match within position errors. For these cases, a complex dedicated treatment is required. While the released Gaia DR2 data, and in particular the availability of accurate five-parameter astrometric solutions, allow addressing the angular resolution difference effects on cross-match, the solution is not trivial and requires carefully planned tests and a thorough analysis. A detailed treatment of this effect will be included in the cross-match of Gaia DR3 and subsequent releases.
6.2 HIPPARCOS 2
While we expect to find Gaia counterparts for most of the HIPPARCOS2 sources, with the exception of the brightest ones, the cross-match results include only about two-thirds of them. This means that according to the adopted cross-match algorithm, only about two-thirds of the HIPPARCOS2 objects have a Gaia counterpart that is compatible within the position errors (i.e. have at least one good neighbour). Hence the HIPPARCOS2 cross-match results clearly show an issue that needs to be investigated.
Around each HIPPARCOS2 object, we calculated a cone search with a fixed radius of 1 arcsec, which propagates the Gaia positions to HIPPARCOS2 epoch exactly in the same way as in the cross-match algorithm described in this paper. Then we selected the nearest neighbour. The cone search is thus consistent with the cross-match and allows us to make a direct comparison of the angular distance distributions obtained with the two methods that were used to determine possible counterparts. We defined two subsamples of HIPPARCOS2 sources. The first includes the cross-matched sources, and the second the additional associations that were found using the cone search. We then tried to identify a characteristic (either in HIPPARCOS2 or in Gaia) that could be used to separate the two samples and thus to understand the nature of the considered issue. The two samples are indistinguishable in terms of size of astrometric errors (see Lindegren et al. 2018, Appendix A, and Arenou et al. 2018 Sect. 4.6, for a detailed discussion of Gaia astrometric errors), magnitude or colour distribution, sky distribution, and many other quantities listed in the HIPPARCOS2 and Gaia catalogues. The only parameters that seem on average to allow separating the two samples are parameters related to the Gaia astrometric solution quality, for example theastrometricGofAl (goodness-of-fit statistics of the astrometric solution for the source in the along-scan direction).
The top panel of Fig. 7 shows the angular distance distribution of the cross-matched sample (red histogram) and the sample of additional sources added with the cone search (blue histogram). The panel clearly shows that the blue sample HIPPARCOS2 sources are found at larger angular distances from their Gaia counterparts than the red ones. The blue sample associations are found atan average angular distance of 75.4 mas, while the red sample sources are found at an average angular distance of 13.8 mas. The middle panel of Fig. 7 shows the astrometricGofAl distribution of the cross-matched sample and the sample of associations added with the cone search, but only for Gaia sources with a five-parameter astrometric solution. The bottom panel of Fig. 7 shows the sky distribution of the astrometricGofAl averaged over healpix obtained with an HEALPix tessellation with resolution Nside = 28 for the Gaia catalogue sources with a five-parameter astrometric solution. The astrometricGofAl sky distribution allows a comparison between the values of the astrometricGofAl for the two samples with values of the Gaia DR2 catalogue.
The adopted cross-match algorithm does not account for the effects that arise because HIPPARCOS2 and Gaia DR2 have different reference frames, HCRF and Gaia-CRF2, respectively. According to Sect. 5.1 of Lindegren et al. (2018), the global alignment of Gaia-CRF2 evaluated by the frame orientation parameters [ϵX, ϵY, ϵZ] at J2015.5 is constrained within ±0.02 mas per axis forfaint sources, and there is no indication of a misalignment larger than ±0.3 mas per axis at the bright end. The HIPPARCOS2 misalignment at epoch J1991.25 is ±0.6 mas per axis. Concerning the spin of the reference frame relative to the quasars, Lindegren et al. (2018) confirmed that the faint reference frame of Gaia DR2 is globally non-rotating to within ±0.02 mas yr−1 in all three axes. However, using a subsample of the HIPPARCOS2 sources present in TGAS (Tycho-Gaia Astrometric Solution, the subsample of Gaia DR1 sources with a five-parameter astrometric solution), the authors suggested that the bright (G ≲ 12) reference frame of Gaia DR2 has a significant (~0.15 mas yr−1) spin relativeto the fainter quasars. According to them, the most reasonable explanation is systematics in the Gaia DR2 proper motions of the bright sources. The effects of either the combination of HCRF and Gaia-CRF2 misalignments or the inertial spin of the Gaia DR2 proper motion system are too small when compared to the bulk of angular distances between HIPPARCOS2 sources associated with the cone search and their Gaia counterparts. These effects therefore cannot account for the bulk of the missing HIPPARCOS2 matches.
The cross-match is particularly critical when two catalogues with such small positional uncertainties are combined. The explanation for the one-third of HIPPARCOS2 sources without a Gaia counterpart compatible within position errors seems to reside in non-optimal astrometric solutions forpart of the HIPPARCOS2 sources, as a result of astrometric perturbations that are probably caused by multiplicity, variability, and/or peculiarities.
Since we do have the a priori knowledge that we should match almost all the HIPPARCOS2 sources, we decided to add the result of the 1 arcsec cone search described above to this paper and make it available to users for download10. The table contains three columns: the Gaia and HIPPARCOS2 identifiers, and the angular distance (in arcsec) for each nearest associated source. Table 9 contains the first ten entries of the cone search results.
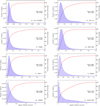 |
Fig. 6 Angular distance distribution of cross-matched pairs included in the BestNeighbour tables. The red curves represent the cumulative distribution of the angular distance. |
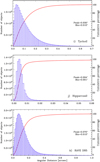 |
Fig. 6 continued. |
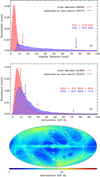 |
Fig. 7 Issues encountered when cross-matching HIPPARCOS2 with Gaia. For a detailed description and explanation of the results shown in this figure, we refer to the main text (Sect. 6.2). |
6.3 Tycho-2
As described in Sect. 4, for the cross-match computations we preferentially used the Tycho-2 set of coordinates propagated to epoch J2000.0. For a fraction of binary sources resolved by Tycho-2, however, the photocentre of the binary was used to obtain the astrometric solution (and thus the binary components have the same coordinates). Since Tycho-2 binaries have separations larger than ~0.8 arcsec, they should also be resolved by Gaia, even if both components are not always present in the Gaia DR2 catalogue. In these cases, which involve 13 098 sources, the cross-match results are very poor, and we matched only 3744 sources. In these cases, both components are included in the cross-match output and will obviously both have the same Gaia counterpart(s). This problem will be addressed for DR3, when we will use the Tycho-2 observed positions, which are given separately for different components and allow a greatly improved number of binary matches.
6.4 GSC 2.3 and PPMXL
The GSC 2.3 and PPMXL catalogues can be considered similar since they are both based on the same photographic plates, but PPMXL has a composite nature (see the Introduction of Roeser et al. 2010). The PPMXL coordinates that are available in the original catalogue were propagated to J2000.0. For cross-match purposes, we computed the position errors at J2000.0 using the position errors at mean epoch available in PPMXL. Nevertheless, the GSC 2.3 position errors are typically four times larger than the propagated PPMXL errors. According to Lasker et al. (2008), GSC 2.3 position errors should be considered conservative estimates of the uncertainties. The epoch difference between Gaia and GSC 2.3 is ~25 yr on average, and it is 15.5 yr for PPMXL.
Given the above, the cross-match results are quite different for the two catalogues. First of all, ~81% of GSC 2.3 sources and only 73.5% of PPMXL sources have a Gaia counterpart. Figure 6 shows that when Gaia counterparts are found, PPMXL sources are closer than GSC 2.3 sources, but this does not mean that the PPMXL astrometry is better than GSC 2.3 astrometry. The longer the time interval for which a given Gaia source is propagated, the larger is the possible misplacement, due to proper motion uncertainties. This explains in part why GSC 2.3 counterparts are found at larger distances than PPMXL counterparts. On the other hand, since PPMXL positions are propagated to J2000.0 using PPMXL proper motions, when they are not accurate, the Gaia counterparts are less easy to find. The PPMXL small position errors also contribute to the counterpart matching failures, while the larger GSC2.3 position errors allow us to find counterparts at larger distances. The net effect is that Gaia counterparts are fewer but closer in PPMXL and more numerous but at larger distances in GSC2.3.
The similarity of the two catalogues instead accounts for the similar issue with duplicates at plate edges and for the similar secondary feature shown in Fig. 6, roughly between 0.8 and 1.8 arcsec, which is due to the presence of mates in cases when one of the two different Gaia sources that share the same best neighbour in the external catalogue is much closer than the other. The duplicate issue is more evident for PPMXL, while the described secondary feature is more distinguishable for GSC 2.3, see Fig. 3.
6.5 2MASS and allWISE
Both 2MASS and allWISE have good astrometry and show no strong indications of an issue with duplicated sources. In particular, 2MASS does not show signatures of astrometric problems or position error underestimation in the maps included in Fig. 4. As detailed in Table 6, the 5.75% of the Gaia sources that match a 2MASS source have a mate (i.e. are resolved in Gaia), this means that the 2MASS cross-match probably already includes most of the Gaia resolved objects and will not benefit much from the more detailed treatment foreseen for DR3 (see Sect. 6.1).
Of the external catalogues included in this study, allWISE is the farthest in the infrared and has the lowest angular resolution. Another characteristic of allWISE is that the Galaxy is less prominent in its surface density distribution (see Fig. 2 in Paper I), meaning that the surface density distribution variations are lower. These three characteristics explain whythe fraction of matched Gaia sources and the fraction of matched allWISE sources are both small. Given its low angular resolution and the relatively small position errors, allWISE will probably appreciably benefit from the more detailed treatment of resolved Gaia sources, but it will not dramatically increase the number of matches.
6.6 SDSS DR9 and Pan-STARRS1 DR1
SDSS DR9 and Pan-STARRS1 DR1 are similar as both are deeper than Gaia, are observed in the same photometric system, and have comparable angular resolutions (~0.7 and ~1.1 arcsec, respectively). However, the Pan-STARRS1 DR1 position errors are definitely smaller than those of SDSS DR9. In the case of Pan-STARRS1 DR1, 90% of the objects have position errors smaller than ~120 mas, while in the case of SDSS DR9, the position errors of the 90% of sources are smaller than ~250 mas.
After the first attempts to cross-match Gaia DR2 with SDSS DR9, we realised that we were matching too few objects compared to what we obtained for DR1. We thus decided to use the astrometry QA summary file described in Sect. 4, and in particular, the listed astrometric differences in RA and Dec with respect to UCAC-3, which are average differences within a given field. We computed the standard deviation considering all fields obtaining ~50 mas in RA and ~70 mas in Dec, and we thus applied a systematic that is common to all SDSS sources, ameliorating the general cross-match. For Gaia DR3, we will apply for each SDSS source the systematic of the corresponding field, and we will use SDSS DR13, which has a new improved photometric calibration with respect to DR9.
Figure 6 shows that the angular distance distribution of matched sources is narrower for Pan-STARRS1 DR1 than for SDSS DR9 and that the peak is closer to zero in the case of Pan-STARRS1 DR1. However, the maps in Figs. 4a and g clearly show a different pattern for SDSS DR9 and Pan-STARRS1 DR1. In the case of SDSS DR9, most Gaia sources are matched as expected, given SDSS DR9 has an higher photometric depth. In the case of Pan-STARRS1 DR1, in contrast, a fraction (~30%) of Gaia sources at high Galactic latitudes are not matched, even though these sources were observed by Pan-STARRS1. An in-depth analysis of the characteristics of matched and not matched Pan-STARRS1 DR1 sources shows that the cause might be an issue with the Pan-STARRS1 DR1 astrometric calibration at high Galactic latitudes, which is highlighted by the small position errors. The Pan-STARRS1 DR1 astrometric calibration is described in Magnier et al. (2016b). It should also be noted that the position error broadening method used in the cross-match algorithm described in this paper (see Sect. 2.1) implies that when the unknown proper motion of a given Gaia source is small, it is somewhat easier to find a match for that source compared with the Gaia sources with a full five-parameter astrometric solution. As a direct consequence, the cross-match result for Pan-STARRS1 DR1 includes the fainter Gaia sources, which constitute the bulk of Gaia sources without proper motions. For both SDSS DR9 and Pan-STARRS1 DR1, the histograms included in Fig. 5 show that the cross-matched sample correctly does not include the faint sources, which are not observed by Gaia.
6.7 URAT 1
URAT 1 is shallower than Gaia, has a larger effective angular resolution, and the position errors for most sources are smaller than 25 mas. The cross-match results summarised in Tables 6 and 8 indicate that ~82% of URAT 1 sources have a counterpart in Gaia and that in most cases, a single Gaia object is matched to a given URAT 1 source (i.e. most matched Gaia sources do not have mates). The angular distance distribution in Fig. 6 shows that the peak is very close to zero (~0.027 arcsec), but Fig. 4j shows that regardless of the shallowness, not all URAT 1 sources have a Gaia counterpart. This can be due to either small astrometric issues, or most probably, to the fact that position errors are underestimated to some degree. The 2MASS survey is also shallower than Gaia, and the map that shows the fraction of its sources that matched Gaia (Fig. 4l) can be compared with the corresponding URAT 1 map. It is clear that the astrometry for 2MASS agrees better with Gaia, as confirmed by the total of 2MASS matched sources (~93%).
External catalogues cross-match results: number of objects compared with the number of matched sources, the fraction of distinct matched Gaia sources and the fraction of distinct matched external catalogue sources.
6.8 APASS DR9
The analysis of APASS DR9 cross-match results clearly shows that this survey is affected by various issues, such as the anomalouslylow steepness of the the cumulative percentage angular distance of matched pairs shown in Fig. 6. Even though the algorithm found a match for more than 90% of the APASS sources with Gaia, a significant fraction of them consists of duplicated sources. This assertion is supported by the angular distance distribution of the nearest neighbours shown in Fig. A.1, where it is evident that a large portion of APASS sources (~8.7 million) have at least one neighbour located at a smaller spatial scale than the angular resolution of the survey (~5 arcsec). In contrast to GSC 2.3, PPMXL, and Pan-STARRS1 DR1, in the case of APASS the presence of duplicates is a more general problem and they are present not only at tile edges. Hence, it is important to recall that DR9 is not the final release of the APASS project, and the cross-match results should be used with particular caution.
6.9 RAVE 5
When we analysed the angular resolution of the external catalogues, we found 5633 pairs of sources and 13 triplets of sources in RAVE 5, which, while having different RAVEIDs, seem to be the same sources and are found at distances closer than 3.0 arcsec from each other (and which can be easily found using a cone search). Since RAVE 5 is a sparse catalogue and the cross-match algorithm we use for sparse catalogues forces a one-to-one match, only one of the sources belonging to a given pair or triplet is matched with a Gaia source.
7 Conclusions
We presented the algorithms we developed for the official cross-match of the high-accuracy Gaia DR2 astrometric data with eight large dense surveys and three sparse catalogues. The defined algorithms are positional and are able to fully exploit the enormous number of Gaia sources with accurate proper motions and parallax measurements using the full five-parameters astrometric covariance matrix on an object-by-object basis. In addition, we included an improved definition of the surface density of observed objects for each catalogue, which allows a better evaluation of the local environment.
The external catalogues and cross-match results were also described. In particular, we analysed the global behaviour of the cross-match results by evaluating their sky distribution, statistical indicators, magnitude, and angular distance distributions. More importantly, we tried to supply scientists, both in the output tables and in the analysis performed in this paper, with all the means to verify the quality of the cross-match results and to understand whether this cross-match is appropriate for their scientific needs.
The excellent data provided by the Gaia DR2, and in particular the proper motions, substantially improve the quality of Gaia counterparts that are found in external catalogues. The high accuracy of the current Gaia data gives a strong drive and powerful tools for understanding and quantifying known complex issues (such as resolution effects, and the presence of astrometric binaries and of duplicated sources) that influence the cross-match results and require non-trivial solutions. The issues will be tackled in the forthcoming Gaia data releases.
Acknowledgements
It is a pleasure to acknowledge the anonymous referee for his/her contribution to the improvement of the content and the readability of our manuscript. We would like to acknowledge the financial support of INAF (Istituto Nazionale di Astrofisica), Osservatorio Astronomico di Roma, ASI (Agenzia Spaziale Italiana) under contract to INAF: ASI 2014-049-R.0 dedicated to SSDC. This work has made use of data from the European Space Agency (ESA) mission Gaia (https://www.cosmos.esa.int/gaia), processed by the Gaia Data Processing and Analysis Consortium (DPAC, https://www.cosmos.esa.int/web/gaia/dpac/consortium). Funding for the DPAC has been provided by national institutions, in particular the institutions participating in the Gaia Multilateral Agreement. We would like to thank G. Fanari, D. Bastieri, B. Goldman, R.A. Power, C. Babusiaux, F. Arenou, C. Fabricius, L. Inno, C. Bailer-Jones, and T. Zwitter for very useful discussions, suggestions, help, and support.
Appendix A Effectiveangular resolution
The effective angular resolving power (or resolution) that results from combining a telescope and its detector is the smallest angle between close objects that can be seen to be separate. The effective angular resolution can be ill defined in astronomy for various reasons: it depends on the brightness difference between two objects, and for ground-based surveys, it is influenced by seeing.
Considering catalogues rather than images, additional considerations must be taken into account. Close sources may have less accurate astrometry and photometry as a result of the disturbing presence of the other nearby source and may be preferentially filtered out from catalogue releases. In addition, when the sky is observed at several different epochs or when fields of view overlap, different observations of the same source may not be recognised as such and duplicated entries are introduced in the catalogue.
The effective angular resolution of the external catalogue is important in order to recognise and correctly match the sources that are resolved in Gaia but not in the external catalogue (see Sect. 6.1). The comparison between the effective angular resolution values reported in Table 3 and the separation distribution in the catalogues is important to evaluate their consistency. In addition, the analysis of the effective angular resolution allows flagging suspected duplicates in the external catalogue, which also can hamper the cross-match results.
In Fig. A.1 we show the results of a search of the nearest neighbour (neglecting additional neighbours except for the nearest) around each object in a given dense survey. We used a fixed radius of 5 arcsec for most surveys, with the exception of Pan-STARRS1 DR1, for which, given its size, we used a 3 arcsec radius, and allWISE and APASS DR9, for which, given their resolution, we used 12 and 10 arcsec, respectively. Figure A.2 shows instead density maps (obtained using a HEALPix tessellation with resolution Nside = 28) of the number of sources with a nearest neighbour within the search radius defined above.
The histograms in Fig. A.1 show the real distribution of nearest neighbours (i.e. the source separation distribution) in the catalogues and should be compared with the effective angular resolutions (dotted vertical lines) listed in Table 3. Nearest neighbours much closer than the marked angular resolution are most probably duplicated sources, while nearest neighbours at distances smaller than but close to the marked angular resolution are still possibly truly distinct sources. The maps shown in Fig. A.2 allow evaluating whether the sky distribution of sources with a close nearest neighbour is correlated with known Galactic features or if they are instead related to the survey observation methods.
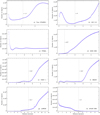 |
Fig. A.1 Angular distance distribution of nearest neighbours in each dense survey considered in this study. The vertical dotted lines indicate the angular resolution as defined in Table 3. |
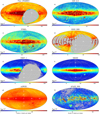 |
Fig. A.2 Sky maps that show for each dense survey the number of objects per healpix that have at least one neighbour within the radius indicated by RLIMIT. The maps are obtained with a HEALPix tessellation with resolution Nside = 28. |
In Fig. A.1, the expected histogram shape of a well-cleaned catalogue is similar to the shapes of SDSS DR9, URAT-1, allWISE, or 2MASS. The initial rise in the Pan-STARRS1 DR1 distance distribution indicates duplicated sources. In Fig. A.2, the fields observed by Pan-STARRS1 DR1 with higher source counts are clearly visible, together with some issues at the borders of the hexagonal gigapixel camera tiles. The over-densities are also clearly distinguishable in Fig. 3. The very small peak, visible at distances close to zero, in GSC 2.3 indicates the Tycho-2 and SKY2000 (Myers et al. 2002) sources. These sources, which were added to complement GSC 2.3 at the bright end, cannot be considered duplicates. Conversely, the second GSC 2.3 peak (around 0.25 arcsec) indicates the presence of duplicated sources that are mainly present at tile edges (see Fig. A.2). For PPMXL no analysis (or flagging of suspected duplicates) is possible because of the composite nature of the catalogue and because the original observed coordinates are not present in the catalogue, which includes only a set of positions propagated to J2000.0. Nevertheless, it is clear from the map in Fig. A.2, but also from Fig. 2d in Paper I, that there is a relevant issue with duplicates. The reverse shape of the APASS DR9 histogram implies that the catalogue is largely affected by duplicated sources: ~14.3% of the objects have at least one neighbour that is located too closely. The map in Fig. A.2 also shows several issues in completeness and duplicates.
This type of analysis will be the base for the planned further cross-match developments when we will deal with the possibly duplicated sources, and we will address the issues related to different angular resolutions between Gaia and the external catalogues in a more complete way.
References
- Abel, D. J., Devereux, D., Power, R. A., & Lamb, P. R. 2004, An O(N log M) Algorithm for Catalogue Crossmatching, Tech. Rep. TR-04-1846, CSIRO ICT Centre [Google Scholar]
- Ahn, C. P., Alexandroff, R., Allende Prieto, C., et al. 2012, ApJS, 203, 21 [NASA ADS] [CrossRef] [Google Scholar]
- Alam, S., Albareti, F. D., Allende Prieto, C., et al. 2015, ApJS, 219, 12 [NASA ADS] [CrossRef] [Google Scholar]
- Arenou, F., Luri, X., Babusiaux, C., et al. 2018, A&A, 616, A17 (Gaia 2 SI) [Google Scholar]
- Casey, A. R., Hawkins, K., Hogg, D. W., et al. 2017, ApJ, 840, 59 [NASA ADS] [CrossRef] [Google Scholar]
- Chambers, K. C., Magnier, E. A., Metcalfe, N., et al. 2016, ArXiv e-prints [arXiv:1612.05560] [Google Scholar]
- Cutri, R. M., Wright, E. L., Conrow, T., et al. 2013, Explanatory Supplement to the AllWISE Data Release Products [Google Scholar]
- Devereux, D., Abel, D. J., Power, R. A., & Lamb, P. R. 2004, Notes on the implementation of Catalogue Cross Matching, Tech. Rep. TR-04-1847, CSIRO ICT Centre [Google Scholar]
- Devereux, D., Abel, D. J., Power, R. A., & Lamb, P. R. 2005, in Astronomical Data Analysis Software and Systems XIV, eds. P. Shopbell, M. Britton, & R. Ebert, ASP Conf. Ser., 347, 346 [NASA ADS] [Google Scholar]
- ESA 1997, The HIPPARCOS and Tycho catalogues. Astrometric and photometric star catalogues derived from the ESA HIPPARCOS Space Astrometry Mission, ESA SP, 1200 [Google Scholar]
- Flewelling, H. A., Magnier, E. A., Chambers, K. C., et al. 2016, ArXiv e-prints [arXiv:1612.05243] [Google Scholar]
- Gaia Collaboration (Brown, A. G. A., et al.) 2016a, A&A, 595, A2 [NASA ADS] [CrossRef] [EDP Sciences] [Google Scholar]
- Gaia Collaboration (Prusti, T., et al.) 2016b, A&A, 595, A1 [NASA ADS] [CrossRef] [EDP Sciences] [Google Scholar]
- Gaia Collaboration (Brown, A. G. A., et al.) 2018a, A&A, 616, A1 (Gaia 2 SI) [NASA ADS] [CrossRef] [EDP Sciences] [Google Scholar]
- Gaia Collaboration (Mignard, F., et al.) 2018b, A&A, 616, A14 (Gaia 2 SI) [NASA ADS] [CrossRef] [EDP Sciences] [Google Scholar]
- Górski, K. M., Hivon, E., Banday, A. J., et al. 2005, ApJ, 622, 759 [NASA ADS] [CrossRef] [Google Scholar]
- Henden, A. A., Templeton, M., Terrell, D., et al. 2016, VizieR Online Data Catalog: II/336 [Google Scholar]
- Høg, E., Fabricius, C., Makarov, V. V., et al. 2000, A&A, 355, L27 [Google Scholar]
- Kunder, A., Kordopatis, G., Steinmetz, M., et al. 2017, AJ, 153, 75 [NASA ADS] [CrossRef] [Google Scholar]
- Lasker, B. M., Lattanzi, M. G., McLean, B. J., et al. 2008, AJ, 136, 735 [NASA ADS] [CrossRef] [PubMed] [Google Scholar]
- Lindegren, L., Hernández, J., Bombrun, A., et al. 2018, A&A, 616, A2 (Gaia 2 SI) [NASA ADS] [CrossRef] [EDP Sciences] [Google Scholar]
- Magnier, E. A., Chambers, K. C., Flewelling, H. A., et al. 2016a, ArXiv e-prints [arXiv:1612.05240] [Google Scholar]
- Magnier, E. A., Schlafly, E. F., Finkbeiner, D. P., et al. 2016b, ArXiv e-prints [arXiv:1612.05242] [Google Scholar]
- Magnier, E. A., Sweeney, W. E., Chambers, K. C., et al. 2016c, ArXiv e-prints [arXiv:1612.05244] [Google Scholar]
- Marrese, P. M., Marinoni, S., Fabrizio, M., & Giuffrida, G. 2017, A&A, 607, A105 (Paper I) [NASA ADS] [CrossRef] [EDP Sciences] [Google Scholar]
- Myers, J., Sande, C., Miller, A., Warren, J., & Tracewell, D. 2002, SKY2000 Master Catalog, Version 4, Goddard Space Flight Center, Flight Dynamics Division [Google Scholar]
- Pier, J. R., Munn, J. A., Hindsley, R. B., et al. 2003, AJ, 125, 1559 [NASA ADS] [CrossRef] [Google Scholar]
- Pineau, F.-X., Motch, C., Carrera, F., et al. 2011, A&A, 527, A126 [NASA ADS] [CrossRef] [EDP Sciences] [Google Scholar]
- Power, R. A. & Devereux, D. 2004, Benchmarking Catalogue Cross Matching, Tech. Rep. TR-04-1848, CSIRO ICT Centre [Google Scholar]
- Roeser, S., Demleitner, M., & Schilbach, E. 2010, AJ, 139, 2440 [NASA ADS] [CrossRef] [Google Scholar]
- Röser, S., Schilbach, E., Schwan, H., et al. 2008, A&A, 488, 401 [NASA ADS] [CrossRef] [EDP Sciences] [Google Scholar]
- Skrutskie, M. F., Cutri, R. M., Stiening, R., et al. 2006, AJ, 131, 1163 [NASA ADS] [CrossRef] [Google Scholar]
- van Leeuwen F. 2007, A&A, 474, 653 [NASA ADS] [CrossRef] [EDP Sciences] [Google Scholar]
- Waters, C. Z., Magnier, E. A., Price, P. A., et al. 2016, ArXiv e-prints [arXiv:1612.05245] [Google Scholar]
- Wright, E. L., Eisenhardt, P. R. M., Mainzer, A. K., et al. 2010, AJ, 140, 1868 [NASA ADS] [CrossRef] [Google Scholar]
- Zacharias, N., Finch, C., Subasavage, J., et al. 2015, AJ, 150, 101 [NASA ADS] [CrossRef] [Google Scholar]
A more exhaustive overview of the mission and DR2 details can be found at https://www.cosmos.esa.int/web/gaia/dr2-papers
HIPPARCOS Celestial Reference Frame.
A description of the original ObjectThin and MeanObjects tables can be found at https://outerspace.stsci.edu/display/PANSTARRS/PS1+Database+object+and+detection+tables
Space Science Data Center – ASI (http://gaiaportal.ssdc.asi.it/), Leibniz Institut für Astrophysik Potsdam – AIP (https://gaia.aip.de/), Astronomisches Rechen-Institut (http://gaia.ari.uni-heidelberg.de/).
All Tables
Comparison of the correct best matches obtained with the broadening method using two different proper motion thresholds (and the proper motion propagation of positions method as baseline).
BestNeighbour statistics: max values of relevant output fields in BestNeighbour tables.
Neighbourhood statistics: min/max values of relevant output fields in Neighbourhood tables.
External catalogues cross-match results: number of objects compared with the number of matched sources, the fraction of distinct matched Gaia sources and the fraction of distinct matched external catalogue sources.
All Figures
|
Fig. 1 Gaia DR2 cross-match schema: for large dense surveys (orange arrows), Gaia is the leading catalogue, while for sparse catalogues (yellow arrows), the external catalogue leads. |
| In the text | |
|
Fig. 2 Cumulative distribution of the angular distance of correct best matches obtained with the broadening method using two different proper motion thresholds (50 and 0 mas yr−1) when compared to the proper motion propagation of positions method (red curve indicated by All label). |
| In the text | |
|
Fig. 3 Surface density distribution for Gaia DR2 and the new external catalogues (see Sect. 4) obtained using a HEALPix (Hierarchical Equal Area isoLatitude Pixelization, Górski et al. 2005) tessellation with resolution Nside = 28 for dense surveys and Nside = 26 for sparse catalogues. In grey we indicate areas that are not covered by the survey. The surface density distribution of external catalogues that were also matched with Gaia DR1 can be found in Paper I. |
| In the text | |
|
Fig. 4 Surface density map for matched sources obtained using a HEALPix tessellation with resolution Nside = 28 for dense surveys. Left column: fraction of Gaia sources that match with an external catalogue. Right column: fraction of distinct external catalogue sources that match with Gaia. |
| In the text | |
|
Fig. 4 continued. |
| In the text | |
|
Fig. 5 Magnitude distribution in the most populated band for the sources in the external catalogues. In grey we plot the catalogue distribution and in red the matched source distribution. |
| In the text | |
|
Fig. 5 continued. |
| In the text | |
|
Fig. 6 Angular distance distribution of cross-matched pairs included in the BestNeighbour tables. The red curves represent the cumulative distribution of the angular distance. |
| In the text | |
|
Fig. 6 continued. |
| In the text | |
|
Fig. 7 Issues encountered when cross-matching HIPPARCOS2 with Gaia. For a detailed description and explanation of the results shown in this figure, we refer to the main text (Sect. 6.2). |
| In the text | |
|
Fig. A.1 Angular distance distribution of nearest neighbours in each dense survey considered in this study. The vertical dotted lines indicate the angular resolution as defined in Table 3. |
| In the text | |
|
Fig. A.2 Sky maps that show for each dense survey the number of objects per healpix that have at least one neighbour within the radius indicated by RLIMIT. The maps are obtained with a HEALPix tessellation with resolution Nside = 28. |
| In the text | |
Current usage metrics show cumulative count of Article Views (full-text article views including HTML views, PDF and ePub downloads, according to the available data) and Abstracts Views on Vision4Press platform.
Data correspond to usage on the plateform after 2015. The current usage metrics is available 48-96 hours after online publication and is updated daily on week days.
Initial download of the metrics may take a while.