Free Access
Fig. 5
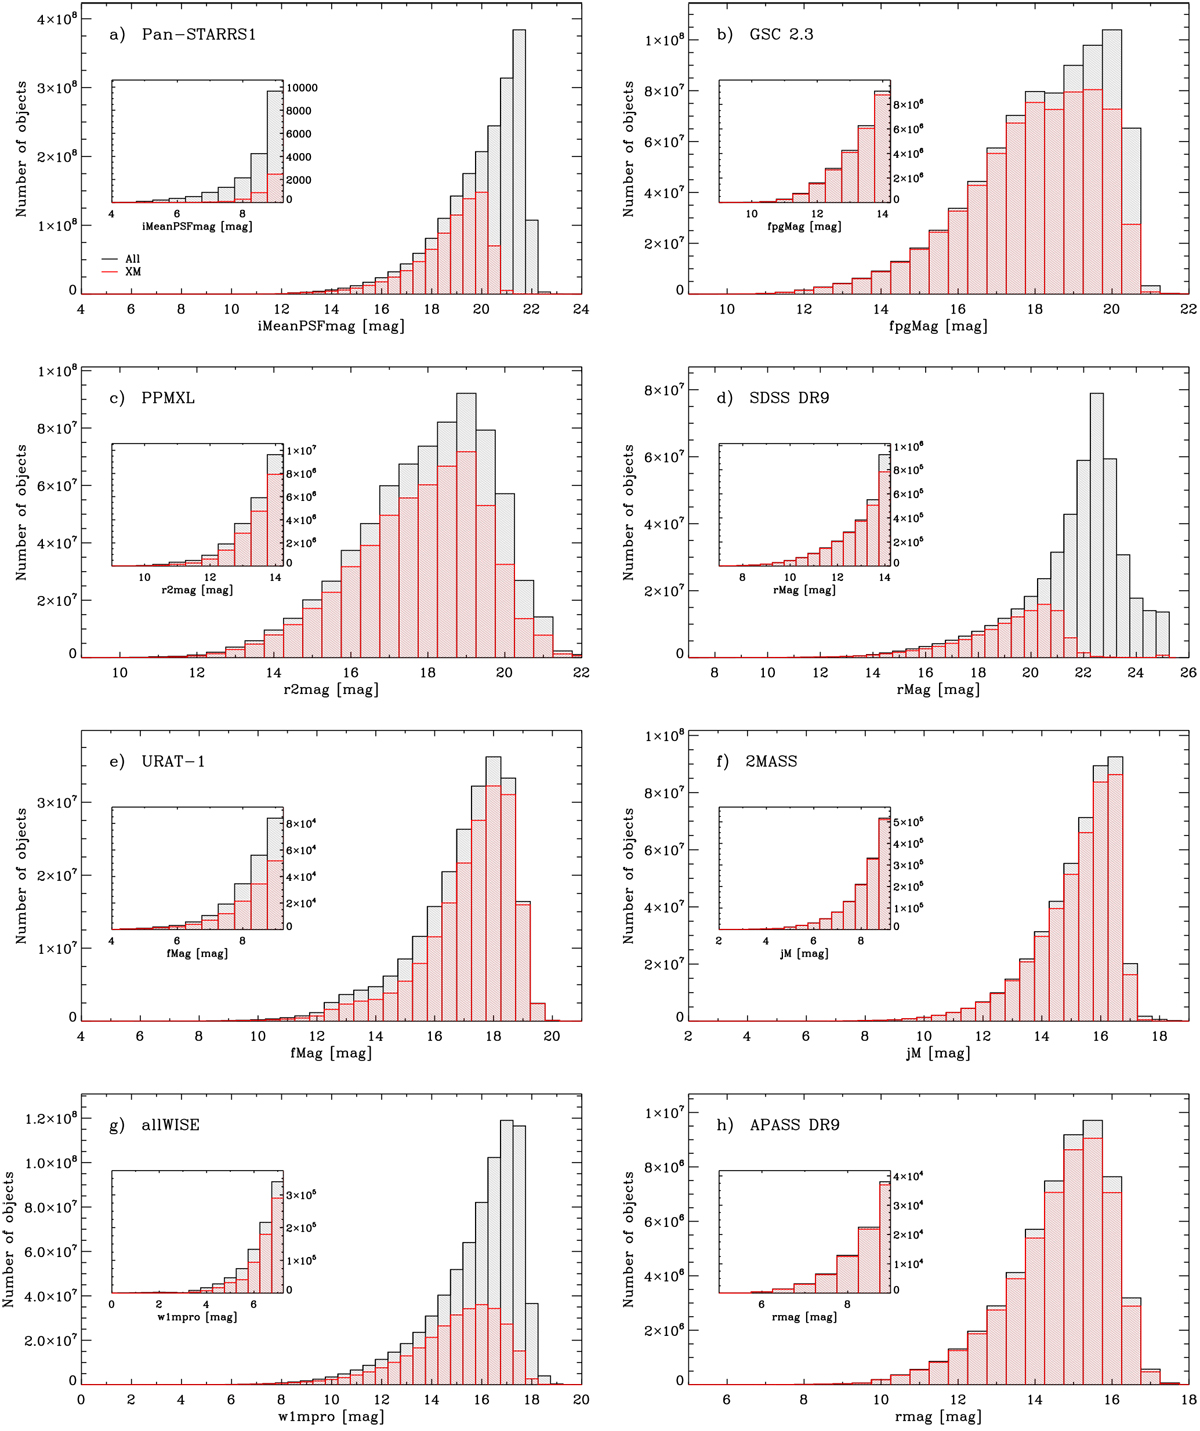
Magnitude distribution in the most populated band for the sources in the external catalogues. In grey we plot the catalogue distribution and in red the matched source distribution.
Current usage metrics show cumulative count of Article Views (full-text article views including HTML views, PDF and ePub downloads, according to the available data) and Abstracts Views on Vision4Press platform.
Data correspond to usage on the plateform after 2015. The current usage metrics is available 48-96 hours after online publication and is updated daily on week days.
Initial download of the metrics may take a while.