Open Access
Fig. 9.
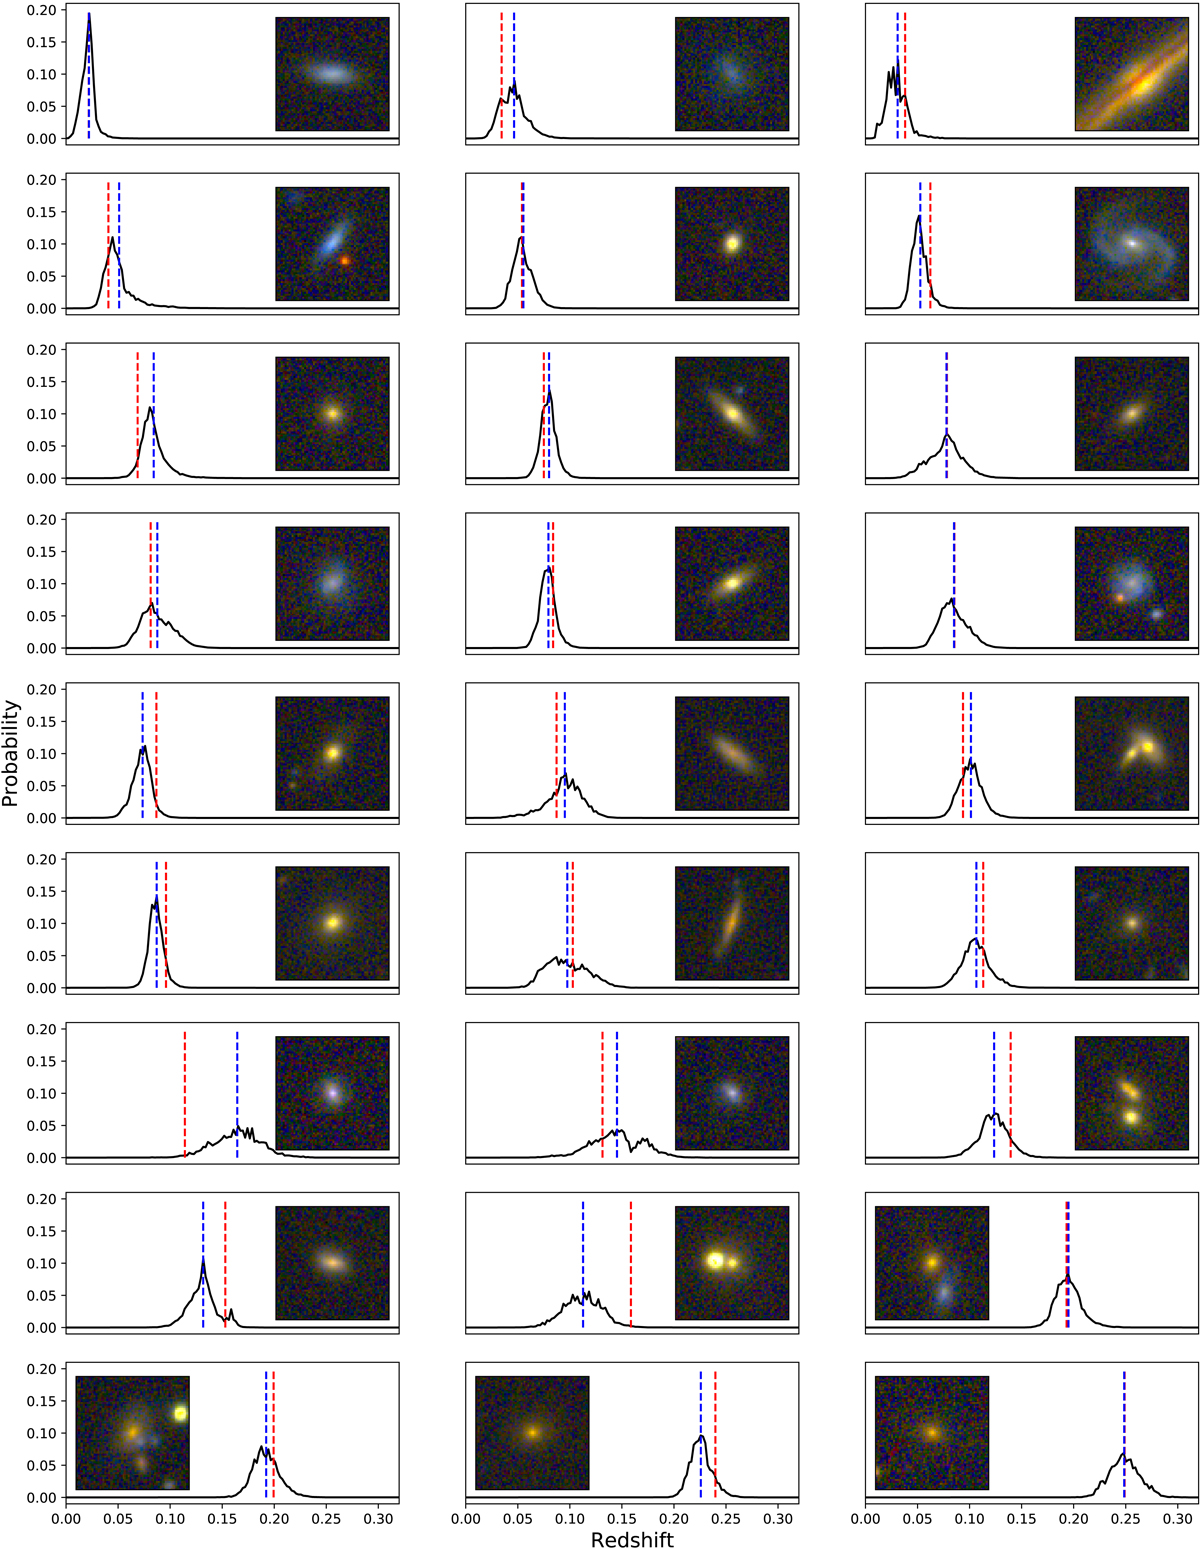
Random examples of PDFs obtained from the CNN. The red dotted lines indicate the values of the spectroscopic redshifts and the blue ones the photometric redshifts estimated by the CNN and computed as the softmax weighted sum of the redshift values in each bin of the PDF.
Current usage metrics show cumulative count of Article Views (full-text article views including HTML views, PDF and ePub downloads, according to the available data) and Abstracts Views on Vision4Press platform.
Data correspond to usage on the plateform after 2015. The current usage metrics is available 48-96 hours after online publication and is updated daily on week days.
Initial download of the metrics may take a while.