Fig. 10.
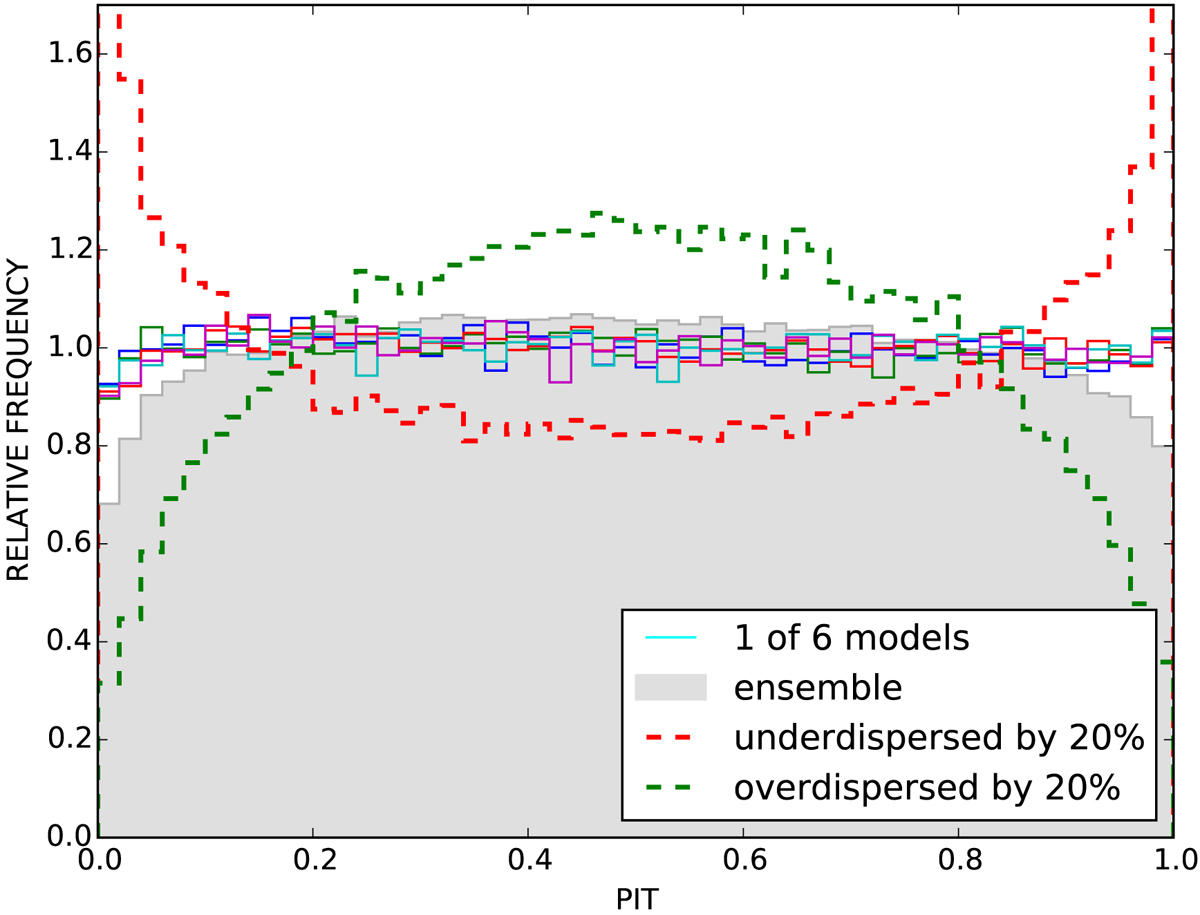
Distribution of the Probability Integral Transforms (PIT) for each of the six models, and for the final PDFs. Each model exhibits a nearly flat PIT distribution, which assesses the very good quality of the PDFs. The PIT distribution of the final (averaged) PDFs (see Sect. 3.8) is slightly over dispersed, as expected from our pessimistic choice of combination. The dashed green and red lines result from expanding and shrinking, respectively, the Δz of a flat model by 20%.
Current usage metrics show cumulative count of Article Views (full-text article views including HTML views, PDF and ePub downloads, according to the available data) and Abstracts Views on Vision4Press platform.
Data correspond to usage on the plateform after 2015. The current usage metrics is available 48-96 hours after online publication and is updated daily on week days.
Initial download of the metrics may take a while.