| Issue |
A&A
Volume 620, December 2018
The XXL Survey: second series
|
|
|---|---|---|
| Article Number | A11 | |
| Number of page(s) | 10 | |
| Section | Catalogs and data | |
| DOI | https://doi.org/10.1051/0004-6361/201833616 | |
| Published online | 20 November 2018 | |
The XXL Survey
XXVI. Optical and near-infrared identifications of the ATCA 2.1 GHz radio sources in the XXL-S Field★
1
INAF – Osservatorio di Astrofisica e Scienza dello Spazio di Bologna,
via Gobetti 93/3,
40129,
Bologna,
Italy
e-mail: This email address is being protected from spambots. You need JavaScript enabled to view it.
2
Physics Department, University of Zagreb,
Bijenicka cesta 32,
10002
Zagreb,
Croatia
3
International Centre for Radio Astronomy Research (ICRAR), University of Western Australia,
35 Stirling Hwy,
Crawley
WA
6009,
Australia
4
Centre for Extragalactic Astronomy, Department of Physics, Durham University, South Road, Durham,
DH1 3LE,
UK
5
CSIRO Astronomy and Space Science,
26 Dick Perry Ave,
Kensington
WA
6151,
Australia
6
INAF – Osservatorio Astronomico di Brera,
via Brera 28,
20121
Milano,
Italy
7
INAF – IASF Milano,
via Bassini 15,
20133
Milano,
Italy
8
AIM, CEA, CNRS, Université Paris-Saclay, Université Paris Diderot, Sorbonne Paris Cité,
91191
Gif-sur-Yvette,
France
Received:
11
June
2018
Accepted:
27
July
2018
Abstract
Context. To investigate the nature of the extragalactic radio sources, it is necessary to couple radio surveys with multiwavelength observations over large areas of the sky. The XMM-Newton Extragalactic (XXL) survey is the largest survey ever undertaken with the XMM-Newton X-ray telescope over two separate fields of 25 deg2 each (XXL-N and XXL-S). At the same time the XXL survey benefits from a wealth of ancillary data spanning from the far-ultraviolet to the mid-infrared.
Aims. In this paper we present the optical, near-infrared (NIR), and X-ray identifications of the 6287 radio sources detected in the 2.1 GHz deep radio survey down to a median rms of σ ≈ 41 μJy beam−1 obtained with the Australia Telescope Compact Array (ATCA) in the XXL-S field. The goal of this paper is to provide a multiwavelength catalogue of the counterparts of the radio sources to be used in further studies.
Methods. For the optical and NIR identification of the radio sources, we used the likelihood ratio (LR) technique, slightly modified in order to take into account the presence of a large number of relatively bright counterparts close to the radio sources. The LR technique was applied to seven optical bands (gBCS, gDec, rBCS, rDec, iBCS, iDec, zDec) and to three NIR bands (J, H, K).
Results. The ten different photometric catalogues have been combined into a single master catalogue where all the photometric information in the optical, NIR, and X-ray bands have been collected for the counterparts of the radio sources. This procedure led to the identification of optical/NIR counterparts for 4770 different radio sources (~77% of the whole radio sample), 414 of which also have an X-ray counterpart. This fraction of identification is in agreement with previous radio-optical association studies at a similar optical magnitude depth, but is relatively low in comparison to recent work conducted in other radio fields using deeper optical and NIR data.
Conclusions. The analysis of optical and NIR properties of radio sources shows that, regardless of the radio flux limit of a radio survey, the nature of the identified sources is strongly dependent on the depth of the optical/NIR used in the identification process. Only with deep enough optical/NIR data will we be able to identify a significant fraction of radio sources with red (zDec-K) counterparts whose radio emission is dominated by nuclear activity rather than starburst activity.
Key words: radio continuum: general / radio continuum: galaxies / catalogs
Full Table 2 is only available at the CDS via anonymous ftp to cdsarc.u-strasbg.fr (130.79.128.5) or via http://cdsarc.u-strasbg.fr/viz-bin/qcat?J/A+A/620/A11
Moved to Kapteyn Astronomical Institute, University of Groningen, Postbus 800, 9700 AV Groningen, The Netherlands and to ASTRON, the Netherlands Institute for Radio Astronomy, Postbus 2, 7990 AA, Dwingeloo, The Netherlands.
© ESO 2018
1 Introduction
Over the past few decades, deep radio surveys down to flux levels of a few μJy confirmed the well-known rapid increase in the number of faint sources towards lower flux level. This corresponds to an upturn in the radio source counts below a few mJy (Condon 1984, Windhorst et al. 1985, Danese et al. 1987, White et al. 1997, Richards 2000, Bondi et al. 2003, Huynh et al. 2005, Fomalont et al. 2006). Star formation and active galactic nuclei (AGN) are the major known processes that can create radio emission detected from extragalactic radio sources (Condon 1992, Condon et al. 2002), with a minor contribution from the supernovae remnants (Dubner & Giacani 2015).
However, on the basis of the radio emission alone it is not possible to distinguish between star-forming galaxies and AGN and to reveal the nature of the radio sources. It has been shown that radio properties such as the distribution of monochromatic radio luminosity of star-forming and AGN galaxies are comparable and overlapping (Sadler et al. 1999). The most straightforward technique used to determine the nature of radio sources is through spectroscopic studies of the optical counterparts.
During the last two decades, despite a great deal of dedicated effort (Hammer et al. 1995, Gruppioni et. al 1999, Prandoni et al. 2001, Afonso et al. 2005, Fomalont et al. 2006, Padovani et al. 2007), the relative fraction of the various populations responsible for the sub-mJy radio counts (AGN, starburst, late- and early-type galaxies), was not well established. For example, while Fomalont et al. (2006) suggested a fraction of AGN near 40% in the sub-mJy regime, Padovani et al. (2007) suggested that this fraction could be 60–80%, while other authors suggested a roughly equal fraction of AGN and star-forming galaxies (Padovani et al. 2009). The main reason for this unclear picture was that the spectroscopic work needed in the optical identification process is very demanding both in terms of telescope time and spectral analysis.
In orderto bypass this problem, several authors have developed new classification methods to separate star-forming galaxies andAGN that are not based on the availability of optical spectra. In particular Smolčić et al. (2008) based their technique on the photometric rest-frame colours to classify local galaxy samples, while Bardelli et al. (2010) used the star formation rates estimated from the optical spectral energy distribution with those based on the radioluminosity to divide the radio sources in passive-AGN (i.e. with very low specific star formation), non-passive AGN, and star-forming galaxies. The application of the photometric rest-frame colour method to the VLA-COSMOS sources (Smolčić et al. 2008) showed that the sub-mJy radio population is a mixture of roughly 30–40% of star-forming galaxies and 50–60% of AGN galaxies, with a minor contribution (~10%) of quasars. Finally, using deeper 3 GHz radio data in the COSMOS field, Smolčić et al. (2017a,b) showed that below ~100 μJy the fraction of star-forming galaxies increases to ~60%, followed by moderate to high radiative luminosity AGN (20%) and low to moderate radiative luminosity AGN (20%). The photometry was crucial for the identification of the nature of the host galaxies of the radio sources.
To investigate the nature of the sub-mJy population, it is necessary to couple radio surveys with multiwavelength observations over a large area of the sky. During the last decade, the Cosmic Evolution Survey (COSMOS; Scoville et al. 2007) has been an exceptional laboratory from this point of view. A deep radio VLA Survey at 1.4 GHz down to an rms value of ~11 μJy beam−1 (Schinnerer et al. 2007, 2010) is, in fact, available over an area of 2 deg2 also covered by deep observations (from the radio to the X-ray) obtained with most of the major space-based (Hubble, Spitzer, GALEX, XMM-Newton, Chandra, Herschel, NuSTAR) and ground-based telescopes (e.g. Keck, Subaru, VLA, ESO-VLT, CFHT UKIRT, NOAO). The combination of a deep radio survey with a set of multiwavelength data has produced milestone results in many different fields such as high-redshift radio galaxies (Carilli et al. 2007), radio source counts (Bondi et al. 2008), the nature of the faint radio population (Smolčić et al. 2008), the cosmic evolution of AGN (Smolčić et al. 2009a), the radio-derived star formation rate density (Smolčić et al. 2009b), and the environment of radio-emitting galaxies (Bardelli et al. 2010). Moreover, new radio observations at 3 GHz over the entire COSMOS field down to an rms value of 2.3 μJy beam−1 have been recently obtained and fully analysed (Smolčić et al. 2017a,b, Delvecchio et al. 2017, Delhaize et al. 2017, Novak et al. 2017).
However, while extragalactic multiwavelength deep surveys over a relatively small area (few deg2) like the COSMOS survey are the ideal tool for obtaining statistically significant samples of faint galaxies, star-forming galaxies, and AGN in order to study their formation and evolution, larger area surveys (tens or hundreds of deg2) are need to reduce the cosmic variance and to study large-scale structure and the environment, and to search for rare objects.
The Ultimate XMM-Newton Extragalactic (XXL) X-ray survey (Pierre et al. 2016, hereafter XXL Paper I) is the largest survey ever undertaken with the XMM-Newton X-ray telescope over two separate fields of 25 deg2 each (XXL-N and XXL-S). Moreover, the XXL fields benefit from ancillary photometric observations ranging from the ultraviolet to the radio bands. A summary of all observations available at all wavelengths targeting the XXL fields is available in XXL Paper I. This new panchromatic deep survey gives us the opportunity to study the multiwavelength properties of the radio sources overa very large area, reducing cosmic variance and opening the possibility of discovering rare objects and phenomena.
In this paper, we use only the data set available in the XXL-S field (RA = 23h 30m00s, Dec = −55°00′00′′). The aim of this paper is to present the master catalogue of the optical, near-infrared (NIR), and X-ray counterparts of the radio sources present in the XXL ATCA 2.1 GHz radio source catalogue (Butler et al. 2018a, hereafter XXL Paper XVIII) and to describe the technique used during the identification process. A detailed description of the classification of the radio sources and their radio luminosity, stellar mass, and star formation rate distributions are reported in Butler et al. (2018b, hereafter XXL Paper XXXI), while the radio spectral indices analysis and the radio source counts are reported in XXL Paper XVIII.
The paper is structured as follows. In Sect. 2 we briefly describe the available data set in the XXL-S field used in this paper. In Sect. 3 we describe the technique used to associate the optical counterparts with the radio sources, while in Sect. 4 we report the results obtained. Finally, in Sect. 5 we give a short description of the optical properties of the radio sources, and in Sect. 6 we summarise our results.
2 XXL-S field data
2.1 Radio data
The 25 deg2 of the XXL-S field has been observed in the radio band with the Australia Telescope Compact Array (ATCA) at 2.1 GHz with a resolution of ~4.76′′ and a sensitivity of σ ~ 41 μJy beam−1 (XXL Paper XVIII, see also Smolčić et al. 2016, hereafter XXL Paper XI). Currently, this is the largest area radio survey probed down to this flux density level. A 5 σ source catalogue of 6287 radio sources has been extracted, 48 of which are considered as multiple sources, i.e. with at least two separate components. A detailed description of the radio observations, data reduction, source extraction, and radio source counts is reported in XXL Paper XVIII.
2.2 Optical and near-infrared data
A detailed description of the multiwavelength data available in the XXL-S field is reported in XXL Paper I and in Fotopoulou et al. (2016, hereafter XXL Paper VI). Here we describe briefly the data set used in this work. All magnitudes are expressed inthe AB system and we quote the limiting magnitude as the third quartile of the respective magnitude distribution (XXL Paper VI).
In the optical bands, the XXL-S field is covered by the Blanco Cosmological Survey (BCS, Desai et al. 2012) in the g, r, i, z bands down to a limiting magnitude of 24.14, 24.06, 23.23, and 21.68, respectively. The BCS survey was obtained using the MOSAIC II imager at the Cerro Tololo Inter-American Observatory (CTIO). The successor of this camera, the Dark Energy Camera (Decam) has been used by the XXL Collaboration (PI: C Lidman) to cover again the XXL-S in the g, r, i, z bands, but at deeper depth than BCS, reaching a magnitude limit of g = 25.73, r = 25.78, i = 25.6, and z = 24.87, respectively.
In the NIR bands, the XXL-S field is covered by the Vista Hemisphere Survey (VHS, PI R., McMahon) a public European Southern Observatory (ESO) large programme survey. The field is covered down to a measured limiting magnitude of J = 21.10, H = 20.77, and K = 20.34.
Given the strong inhomogeneity of the methods used to obtain the public catalogues and in order to optimise the information obtainable from the available observations, a new photometric extraction has been performed within the XXL Collaboration (XXL Paper VI) and a multiwavelength catalogue has been obtained. This catalogue contains more than four million entries and 15 different magnitudes from the ultraviolet (Galaxy Evolution Explorer, GALEX bands, Morrissey et al. 2005, Martin & GALEX Team 2005), optical (g, r, i, z, from BCS and Decam surveys), NIR (J,H,K from VISTA), and mid-infrared (IRAC and WISE bands from 3.4 μ to 22 μm, Wright et al. 2010; Ashby et al. 2013). A detailed description of the technique used to construct the multiwavelength catalogue is reported in XXL Paper VI. This multiwavelength catalogue has been used as input in the identification process of the XXL-S radio sources.
2.3 X-ray
The XMM-Newton X-ray Telescope observed the XXL-S field as part of the XMM-Newton Extragalactic Survey with a depth of ~6 × 10⁻¹⁵ ergs s−1 cm−2 in the 0.5–2 keV band and ~2 × 10⁻¹⁴ ergs s−1 cm−2 in the 2–10 keV band (XXL Paper I). The optical and NIR identification of the X-ray sources are reported in Chiappetti et al. (2018, XXL Paper XXVII).
3 Likelihood technique
3.1 Definition
For the optical identification of the 6287 radio sources in the XXL-S field, we used the likelihood ratio (LR) technique (Sutherland & Saunders 1992; Ciliegi et al. 2003; Brusa et al. 2007). The likelihood ratio is defined as the ratio of the probability that a given source is the true optical counterpart to the probability that the same source is an unrelated background object,
 (1)
(1)
where q(m) is the expected probability distribution of the true optical counterparts as a function of magnitude, f(r) is the probability distribution function of the positional errors, and n(m) is the surface density of background objects with magnitude m (see Ciliegi et al. 2003 for a detailed discussion on the procedure to calculate q(m), f(r), and n(m)). For each source we adopted an elliptical Gaussian distribution for the positional errors with the errors in RA and Dec on the radio position reported in the radio catalogue and assuming an optical position uncertainty as a value of 0.3 arcsec in RA and Dec.
We adopted a 3′′ radius for the estimate of q(m), obtained by subtracting the expected number of background objects (n(m)) from the observed total number of objects listed in the catalogue around the positions of the radio sources.
3.2 Background source distribution correction
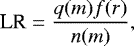
With the procedure described in the previous section, q(m) is well defined up to magnitudes of approximately 23.0−23.5, depending on the band. At fainter magnitudes, the number of objects around the radio sources turned out to be smaller than expected from the background global counts n(m). This would result in an unphysical negative q(m), which would not allow the application of this procedure at these magnitudes. This effect can be clearly seen in the magnitude distributions of Fig. 1, where for the Decam catalogue in the z band (zDec), we report the background magnitude distribution n(m) (blue dashed histogram), the observed magnitude distribution around each radio source within a radius of 3 arcsec (black solid histogram), and the expected magnitude distribution of the true optical counterparts q(m) (red dash-dot-dot-dot histogram) calculated as the difference of the two previous distributions. At magnitudes fainter than zDec = 23.5, we have the unphysical situation that the observed magnitude distribution around the radio sources is lower than the value of the background distribution. This effect was already noted by Brusa et al. (2007) during the identification of the X-ray sources in the COSMOS field.
The reason for this effect is the presence of a large number of relatively bright optical counterparts close to the radio sources. These objects make it difficult to detect fainter background objects in the same area. As a consequence, at faint magnitudes, the background distribution calculated around the radio sources is underestimated when compared to the background calculated from the global field.
This situation is visually represented in Fig. 2, where a bright optical galaxy has been assumed as the optical counterpart of a radio source, the position of which is represented by the red cross. The large red circle represents the area used to estimate the observed magnitude distribution around the radio sources (a circle of radius 3 arcsec in our case). In this example there are eight sources that should contribute to the observed magnitude distribution:the bright optical galaxy (counterpart of the radio source) and seven background sources represented by the seven stars in the figure (five yellow six-pointed stars plus two blue five-pointed stars). However, while the bright galaxy and the five six-pointed sources are easily detected and will contribute to the observed magnitude distribution, the two blue five-pointed stars cannot be detected because they are in the area masked by the bright galaxy. This causes an underestimation of the magnitude distribution of faint sources.
To estimate the correct n(m) to be used at faint magnitudes in the likelihood calculation, following Brusa et al. (2007) we used the technique described below. We have randomly extracted 5000 sources from the optical sample with the same magnitude distribution expected forthe optical counterparts. Then we computed the background surface density around these objects. The n(m) computed with this method is consistent with the global n(m) for brighter magnitudes (approximately up to 23.0−23.5), but it is significantly lower at fainter magnitudes. Therefore, for brighter magnitudes we used the global value as the input n(m) in the likelihood procedure, while for the fainter magnitudes we used the n(m) computed as explained above. This allowed us to identify as probable counterparts a few tens of very faint sources that would have been missed without this correction in the expected n(m).
In Fig. 3, the new n(m) and q(n) distributions calculated with the new method explained above are shown. As shown in the figure, now the observed (solid line) magnitude distribution around the radio sources (background and counterparts of radio sources) is, as expected, always greater than the background distribution (dashed line), giving a q(m) distribution without negative values.
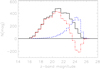 |
Fig. 1 Observed magnitude distribution of all optical objects present in the zDec band catalogue within a radius of 3′′ around eachradio source is shown by the black solid histogram. The expected distribution of background objects in the same area n(m) is shown by the blue dashed histogram. The difference between these two distributions (q(m)) is shown by the red dot-dashed histogram. At magnitudes fainter than z = 23.5 the q(m) histogram has negative, unphysical values. |
 |
Fig. 2 Visual representation of the effect that produces negative values at faint magnitudes of the expected probability distribution of the true optical counterparts. The large red circle represents the area used to estimate the observed magnitude distribution around the radio source, whose position is represented by the red cross. Background sources are represented by yellow six-pointed stars and blue five-pointed stars. Due to the presence of a large number of relatively bright optical counterparts (represented in the figure), faint background objects in the area masked by the bright sources (blue five-pointed stars) are not detected. This causes an underestimation of the observed magnitude distribution calculated around the position of the radio sources. |
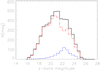 |
Fig. 3 Observed magnitude distribution of all optical objects present in the zDec band catalogue within a radius of 3 arcsec around each radio source is shown by the solid black histogram. The expected distribution of background objects in the same area, estimated using the procedure described above, n(m) is shown by the blue dashed histogram. The difference between these two distributions, q(m), is shown by the red dot-dashed histogram |
3.3 Counterpart selection procedure
The presence or absence of more than one optical candidate for the same radio source gives us additional information to that contained in LR. The reliability Relj for object j being the correct identification is given by the equation (Sutherland & Saunders 1992)
 (2)
(2)
where the sum ∑i is over the set of all candidates for this particular source, while Q is the probability that the optical/NIR counterpart of the source is brighter than the magnitude limit of the optical catalogue (Q = ∫mlimq(m)dm). The Q value has been estimated by the comparison between the expected number of identifications derived from the integral of the q(m) distribution (red dot-dashed histogram in Fig. 3) and the total number of the radio sources. The Q value has been calculated for each band considered and we find that a value of Q = 0.8 is applicable to all bands.
Once q(m), f(r), and n(m) were obtained, we computed the LR value for all the optical sources within a distance of 3′′ from the radio position. Having determined the LR for all the optical candidates, we had to choose the best threshold value for LR (LRth) to discriminate between spurious and real identifications. As the LR threshold we adopted LRth = (1 − Q) = 0.2. With this value, according to Eq. (2) and considering that we assumed Q equal to 0.8, all the optical counterparts of radio sources with only one identification (the majority in our sample) and LR > LRth have a reliability greater than 0.5. This choice also approximately maximises the sum of sample reliability and completeness and has been adopted also in previous paper (Ciliegi et al. 2003).
4 Results of the likelihood ratio technique
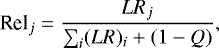
The optical/NIR photometric data cover each a slightly different area of the sky. In Figs. 4 and 5, we show the overlap of the optical and radio positions for all the bands considered. As is evident in the figures, while the NIR data in the J, H, and K bands (Fig. 5) cover the radio sample in a uniform way with only few radio sources left out, the optical bands do not cover the radio sample in a homogeneous way. All the data from the BCS survey (gBCS, rBCS, iBCS, and zBCS) cover almost the whole radio sample (Fig. 4) at a shallower magnitude limit (see Sect. 2.2), while the Dec data in the g, r, and i bands coveronly partially the radio sample (Fig. 4). Finally, the zDec data offer the best data set in terms of covered area and magnitude limit. In order to maximise the number of identifications, we applied the LR technique to all the optical and NIR available data, excluding only the zBCS data since the zDec data cover the same area at deeper magnitude limit. In summary, the LR technique has been applied to seven optical (gBCS, gDec, rBCS, rDec, iBCS, iDec, zDec) and three NIR (J, H, K) bands.
Considering all the available data, 6176 radio sources (from a total of 6287 radio sources) are inside the area covered by at least one optical or NIR band, i.e. only for 111 radio sources is it impossible to obtain the information on the optical/NIR counterpart because we have no optical/NIR data for them.
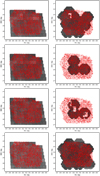 |
Fig. 4 Overlap between the position of the optical sources (black tiles) and radio sources (red points). From top left to bottom right the bands are gBCS, gDec, rBCS, rDec, iBCS, iDec, zBCS, and zDec. |
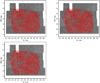 |
Fig. 5 Overlap between the position of the NIR sources (black tiles) and radio sources (red points). Top left: J band, top right: H band, bottom panel: K band. |
4.1 Identified radio sources
The results of the identification process are summarised in Table 1. For each band, we report the magnitude limit, the number of radio sources within the area covered by the corresponding optical or NIR band, the number of reliable identifications obtained using the LR technique, and the relative fraction of identification. As expected, the fraction of identification is function of the depths of the optical/NIR data available, varying from 48.3% for the shallower data (gBCS) to 72.2% for the the deepest data (zDec). These fractions of identification are consistent with previous radio-optical association studies at similar optical magnitude depths. Ciliegi et al. (2005) identified 74% of the radio sources in the VIMOS-VLA Deep Survey (VVDS) field using optical data with a magnitude limit of IAB ~25.0. However, these fractions of identification are relatively low in comparison to similar work conducted in other radio fields using deeper optical and NIR data. Recently, for example, Smolčić et al. (2017a) have found counterparts for 93% of the 3 GHz radio sources in the COSMOS field using photometric catalogues in the Y, J, H, Ks bands down to a 3σ (3′′ diameter aperture) of 25.3, 25.2, 24.9, and 24.5 AB magnitude.
The ten different catalogues have been combined in a single master catalogue of optical/NIR counterparts using the following procedure:
- 1.
When a radio source is associated with the same counterpart in all the catalogues, we assign this counterpart to the radio source in the final master catalogue.
- 2.
When a radio source is associated with different counterparts in different optical/NIR catalogues, we may have two different cases:
- a)
All the counterparts are detected in at least one common optical/NIR band (e.g. all the counterparts are detected in the zDec catalogue). There are 73 radio sources in this case.
- b)
None of the counterparts has a detection in a common band (e.g. one counterpart is detected in the zDec band and the other counterpart is detected in the gDec band but not in the zDec band). There are 373 radio sources in this case. In the first case we selected the counterpart of the radio sources on the basis of reliability values in the common band, while in the second case we selected the nearest counterpart to the radio source because it is impossible to compare reliability values from different bands.
- a)
This procedure led to the identification of optical/NIR counterparts for 4770 different radio sources, i.e. for 77% (4770/6176) of the entire radio sample. Although the final master catalogue is inhomogeneous in terms of depth and area covered (see Figs. 4 and 5), it is an important tool for a detailed photometric analysis of the counterparts of the radio sources (see XXL Paper XXXI).
Among the 4770 optical/NIR counterparts of the XXL radio sources, there are 414 sources with an X-ray counterpart that had flux measurements in at least one XMM band (see XXL Paper XXXI, and XXL Paper VI)
Table 2 shows representative entries for the optical/NIR and X-ray counterparts of the XXL-S radio sources. For each identified radio source we report the IAU name (Col. I) and the ID number (Col. II) as in the radio catalogue published in XXL Paper XVIII, the radio peak flux density Sp corrected for the bandwidth smearing (Col. III), the integrated flux density Sint (Col. IV), and the separation in arcsec between the radio position and the optical/NIR position of the associated counterpart (Col. V). Multicomponent radio sources haveSp = −99 (see XXL Paper XVIII), while unidentified radio sources have a separation value (Col. V) equal to −1. From Col. VI to Col. XV we report the AB magnitude in ten different bands. Values of 99.99 are for radio sources outside the area covered by the optical/NIR data. The 111 radio sources without optical/NIR data available (see above) all have magnitude values equal to 99.99. Negative values represent magnitude limits (i.e. sources not detected but observed in that band). The magnitude value after the minus sign gives the magnitude limit in that band (see Sect. 2.2 and Table 1). Finally, in Col. XVI we report the X-ray name, while in Cols. XVII and XVIII we report the X-ray flux in the 0.5–2.0 keV and 2.0–10 keV bands. The full catalogue is available as a queryable database table via the XXL Master Catalogue browser1. Copies are also deposited at the Centre de Données astronomiques de Strasbourg (CDS)2.
In Fig. 6, we report the histogram of the separation value (in arcsec) between the radio and the optical/NIR position (Col. 5 in Table 2) and the mag z from the Dec survey versus radio-optical/NIR separation. As shown in the figure, the majority of the optical and NIR sources associated with the radio sources are within a distance of 1.0 arcsec (3920 over a total of 4770 association, i.e. ~82%), with only 262 radio sources (~5%) associated with a counterpart at a distance greater than 1.5 arcsec and there is no correlation between the magnitude of the counterparts and the radio-optical/NIR separation.
Results of the identification process using the likelihood ratio technique in seven different bands
Example entries for the catalogue of the optical and NIR counterparts of the radio sources detected in the XXL-S field.
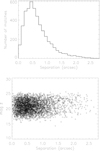 |
Fig. 6 Top panel: distributionof the separation between the radio source in the XXL-S field and their optical/NIR counterparts. Bottom panel: mag z from the Dec survey vs. separation between the radio source and their optical/NIR counterparts. |
4.2 Unidentified radio sources
Excluding the 111 radio sources for which no optical/NIR data are available, we have a total of 1406 unidentified radio sources.
In Fig. 7 (top panel), we show the integrated radio flux distribution Sint for the entire radio sample of 6287 radio sources (black histogram) and for the 4770 radio sources with an optical/NIR counterpart (orange histogram), while in the bottom panel we show the fraction of identified radio sources as function of the radio flux. In Fig. 8, we show the integrated radio flux distribution for the 1406 radio sources without optical/NIR counterparts. As is evident from Figs. 7 and 8, the majority of the unidentified radio sources are sources with the fainter radio fluxes. Finally, in Fig. 9 we show the distribution in right ascension and declination of the 1406 unidentified radio sources.
Although the area covered and the magnitude limit of the different surveys used are not uniform, the unidentified radio sources are smoothly distributed over the whole area and actually follow the zDec area coverage. This result suggests that, as expected, the identification process is dominated by the data in the zDec band, for which we have the best data set both in terms of area covered and magnitude limit.
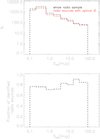 |
Fig. 7 Top panel: total radio flux distribution for the whole radio sample (black histogram) and for the 4770 radio sources with an optical identification (red histogram). Bottom panel: fraction of identified radio sources as a function of the radio flux. |
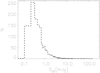 |
Fig. 8 Total radio flux distribution for 1517 radio sources unidentified in the optical and NIR bands. |
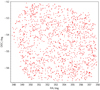 |
Fig. 9 Position of the 1406 unidentified radio sources. |
5 Optical properties of radio sources
In Fig. 10, we report the magnitude distributions of the optical and NIR counterparts of the radio sources (orange dashed lines) compared to the magnitude distributions of the entire XXL-S optical or NIR samples in the relative band.
From these figures it is evident that the magnitude distribution of the radio source counterparts is flatter than that from the entire optical/NIRsample, showing that a significant fraction of radio sources are associated with relatively bright optical galaxies/AGN. Since there is no correlation between the magnitude of the counterparts and the radio-optical/NIR separation (see bottom panel of Fig. 6), we can exclude that this result is due to (or at least is dominated by) the loss of faint sources behind brighter sources.
Moreover, from Fig. 10 it is interesting to note that the magnitude distributions of the radio sources has a peak coincident with the peak of the total distribution, i.e. coincident with the magnitude limit of the optical/NIR data. This result confirms that the relatively low fraction of optical/NIR identifications of the radio sources within the area covered by the optical/NIR data (see Table 1) is mainly due to a relatively shallow limiting magnitude of the available data.
An overview of the optical/NIR properties of the identified radio sources is shown in the four panels of Fig. 11, where we report mag zDec versus radio flux (panel a); (zDec−K) colour versus zDec magnitude (panel b); (zDec−K) colour versus radio flux (panel c); and (zDec−K) colour versus the radio-to-optical ratio R defined as R = S × 100.4(mag−12.5), where S and mag are the radio flux in mJy and the apparent magnitude of the sources, respectively (panel d). The red symbols in all panels show objects with mag zDec > 21.5. From the figure it is evident that while there is no correlation between the magnitude and the radio flux (panel a), redder objects (with zDec−K) > 2) become evident only in optically deep surveys, i.e. at magnitude fainter than z ~ 21.5 (panel b), although present at any radio flux levels (panel c). Finally, panel d shows that redder object (with (zDec−K) > 2) are only associated with radio sources with an optical-to-radio ratio R > 1000, i.e. sources generally associated with early-type galaxies whose radio emission is dominated by nuclear activity (Ciliegi et al. 2003).
Figure 11 shows that regardless of the radio flux limit of a radio survey, the nature of the identified sources is strongly dependent on the depth of the optical/NIR used in the identification process. As first noted by Gruppioni et. al (1999), only with deep enough optical/NIR data will we be able to identify a significant fraction of radio sources with red (zDec−K) counterparts, whose radio emission is dominated by nuclear activity rather than starburst activity. This result must be taken into account in any identification processes of radio sources and can explain the difference in the results of the radio sources identification found in different works (see discussion in Sect. 1 and reference therein).
The classification of the 4770 optical/NIR counterparts of the radio sources are beyond the scope of this paper, but they are described inXXL Paper XXXI. The results are described briefly as follows. Using several different diagnostic diagrams based on the photometric properties (from radio to X-ray) of the sources, as well as optical spectral templates, emission lines, and colours, XXL Paper XXXI classified the 4770 optical/NIR counterparts as 12 stars, 1729 low-excitation radio galaxies (LERGs), 1159 radio-loud high-excitation radio galaxies (RL HERGs), 296 radio-quiet high-excitation radio galaxies (RQ HERGs), 558 star-forming galaxies (SFGs), and 1016 unclassified sources. For a detailed description of the classification and properties of the cross-matched radio sources, see XXL Paper XXXI.
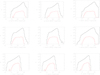 |
Fig. 10 Magnitude distributions for the entire optical/NIR samples (solid black line) and for the optical/NIR counterparts of the radio sources (dashed red line) for all the bands considered. |
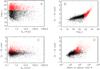 |
Fig. 11 Radio-optical-NIR properties of the identified radio sources. Panel a: mag z from the Dec survey vs. the radio flux; panel b: (zDec -K) colour vs. zDec magnitude; panel c: (zDec -K) colour vs. radio flux; panel d: (zDec -K) colour vs. radio-to-optical ratio R. Red symbols show objects with mag zDec > 21.5 (see text fordetails). |
6 Conclusion
Starting from the sample of 6287 radio sources detected at 2.1 GHz in the XXL-S field (XXL Paper XVIII) and from the multiwavelength catalogue (from optical to X-ray bands) available in the same field (XXL Paper VI) we used the likelihood ratio technique toidentify the counterparts of the radio sources. Since the optical photometric data cover slightly different areas of the sky, in order to maximise the number of identifications we applied this technique to all the available data: seven optical (gBCS, gDec, rBCS, rDec, iBCS, iDec, zDec) and three NIR (J, H, K) bands. We found optical/NIR counterparts for 4770 different radio sources in the XXL-S field, 414 of which have also been detected in the X-ray band.
This fraction of identification is in agreement with previous radio-optical association studies at similar optical magnitude depth (Ciliegi et al. 2005), although is relatively low in comparison to recent work conducted in other radio fields using deeper optical and NIR data (Smolčić et al. 2017a). The analysis of the magnitude distributions of the optical/NIR samples and of the counterparts of the radio sources shows that the magnitude distributions of the radio sources has a peak coincident with the peak of the total distribution, i.e. coincident with the magnitude limit of the optical/NIR data. This confirms that with deeper optical/NIR data we could expect an optical magnitude distribution of the radio sources with a maximum brighter than the limiting magnitude and then a higher fraction of identifications.
Finally, the analysis of the optical/NIR properties of the identified radio sources shows that the depth of the data used in the identification process plays a significant role in establishing the nature of the identified radio sources.
The sample of the 4770 counterparts of the radio sources has been analysed and classified in XXL Paper XXXI. Further papers to fully explore the properties of the radio sources in the XXL-S field are in progress within the XXL Collaboration.
Acknowledgements
XXL is an international project based around an XMM Very Large Programme surveying two 25 deg2 extragalactic fields at a depth of ~6 × 10⁻¹⁵ erg cm−2 s−1 in the [0.5–2.0] keV band for point-like sources. The XXL website is http://irfu.cea.fr/xxl. Multi-band information and spectroscopic follow-up of the X-ray sources are obtained through a number of survey programmes, summarised at http://xxlmultiwave.pbworks.com/. The Australia Telescope Compact Array is part of the Australia Telescope National Facility, which is funded by the Australian Government for operation as a National Facility managed by CSIRO. Based in part on data acquired through the Australian Astronomical Observatory via programme A/2016B/107. S.F. acknowledges support from the Swiss National Science Foundation. V.S. acknowledges support from the European Union’s Seventh Frame-work programme under grant agreement 333654 (CIG, “AGN feedback”). J.D. acknowledges support from the European Unions Seventh Frame-work programme under grant agreement 337 595 (ERC Starting Grant, “CoSMass”). The Saclay group acknowledges long-term support from the Centre National d’Études Spatiales (CNES).
References
- Afonso, J., Georgakakis, A., Almeida, C., et al. 2005, ApJ, 624, 135 [NASA ADS] [CrossRef] [Google Scholar]
- Ashby, M.L.N., Stanford, S.A., Brodwin, M., et al. 2013, ApJS, 209, 22 [NASA ADS] [CrossRef] [Google Scholar]
- Bardelli, S., Schinnerer, E., Smolčić, V., et al. 2010, A&A, 511, A1 [NASA ADS] [CrossRef] [EDP Sciences] [Google Scholar]
- Bondi, M., Ciliegi, P., Zamorani, G., et al. 2003, A&A, 403, 857 [NASA ADS] [CrossRef] [EDP Sciences] [Google Scholar]
- Bondi, M., Ciliegi, P., Schinnerer, E., et al. 2008, ApJ, 681, 1129 [NASA ADS] [CrossRef] [Google Scholar]
- Brusa, M., Zamorani, G., Comastri, A., et al. 2007, ApJS, 172, 353 [NASA ADS] [CrossRef] [Google Scholar]
- Butler, A., Huynh, M., Delheize, J., et al. 2018a, A&A, 620, A3 (XXL Survey, XVIII) [NASA ADS] [CrossRef] [EDP Sciences] [Google Scholar]
- Butler, A., Huynh, M., Delheize, J., et al. 2018b, A&A, 620, A16 (XXL Survey, XXXI) [NASA ADS] [CrossRef] [EDP Sciences] [Google Scholar]
- Carilli, C.L., Murayama, T., Wang, R., et al. 2007, ApJS, 172, 518 [NASA ADS] [CrossRef] [Google Scholar]
- Chiappetti, L., Fotopoulou, S., Lidman, C., et al. 2018, A&A, 620, A12 (XXL Survey, XXVII) [NASA ADS] [CrossRef] [EDP Sciences] [Google Scholar]
- Ciliegi, P., Zamorani G., Hasinger G., et al. 2003, A&A, 398, 901 [NASA ADS] [CrossRef] [EDP Sciences] [Google Scholar]
- Ciliegi, P., Zamorani, G., Bondi, M., et al. 2005, A&A, 441, 879 [NASA ADS] [CrossRef] [EDP Sciences] [Google Scholar]
- Condon, J.J., 1984, ApJ, 287, 461 [NASA ADS] [CrossRef] [Google Scholar]
- Condon, J.J. 1992, ARA&A, 30, 575 [NASA ADS] [CrossRef] [MathSciNet] [Google Scholar]
- Condon, J.J., Cotton, W.D., & Broderick, J.J. 2002, ApJ, 124, 675 [Google Scholar]
- Danese, L., De Zotti, G., Franceschini, A., & Toffolatti, L. 1987, ApJ, 318, L15 [NASA ADS] [CrossRef] [Google Scholar]
- Delhaize, J., Smolčić, V., Delvecchio, I., et al. 2017, A&A, 602, A4 [NASA ADS] [CrossRef] [EDP Sciences] [Google Scholar]
- Delvecchio, I., Smolčić, V., Zamorani, G., et al. 2017, A&A, 602, A3 [NASA ADS] [CrossRef] [EDP Sciences] [Google Scholar]
- Desai, S., Armstrong, R., Mohr, J.J., et al. 2012, ApJ, 757, 83 [NASA ADS] [CrossRef] [Google Scholar]
- Dubner, G., & Giacani, E. 2015, A&ARv, 23, 3 [NASA ADS] [CrossRef] [EDP Sciences] [Google Scholar]
- Fomalont, E.B., Kellermanm, K.I., Cowie, L.L., et al. 2006, ApJS, 167, 103 [NASA ADS] [CrossRef] [Google Scholar]
- Fotopoulou, S, Pacaud F., Paltani S., et al. 2016, A&A, 592, A5 (XXL Survey, Paper VI) [NASA ADS] [CrossRef] [EDP Sciences] [Google Scholar]
- Gruppioni, C., Mignoli, M., & Zamorani, G. 1999, MNRAS, 304, 199 [NASA ADS] [CrossRef] [Google Scholar]
- Hammer, F., Crampton, D., Lilly, S., LeFevre, O., & Kenet, T. 1995, MNRAS, 276, 1085 [NASA ADS] [Google Scholar]
- Huynh, M.T., Jackson, C., Norris, R., & Prandoni, I. 2005, AJ, 130, 1373 [NASA ADS] [CrossRef] [Google Scholar]
- Martin, C., & GALEX Team 2005, IAU Symp., 216, 221 [NASA ADS] [Google Scholar]
- Morrissey, P., Schiminovich, D., Barlow T.A., et al. 2005, ApJ, 770, 40 [Google Scholar]
- Novak, M., Smolčić, V., Delhaize, J., et al. 2017, A&A, 602, A5 [NASA ADS] [CrossRef] [EDP Sciences] [Google Scholar]
- Padovani, P., Manieri, V., Tozzi, P., et al. 2007, ASPC, 380, 205 [NASA ADS] [Google Scholar]
- Padovani, P., Manieri, V., Tozzi, P., et al. 2009, ApJ, 694, 235 [NASA ADS] [CrossRef] [Google Scholar]
- Pierre, M., Pacaud, F., Adami, C., et al. 2016, A&A, 592, A1 (XXL Survey, Paper I) [NASA ADS] [CrossRef] [EDP Sciences] [Google Scholar]
- Prandoni, I., Gregorini, L., Parma, P., et al. 2001, A&A, 369, 787 [NASA ADS] [CrossRef] [EDP Sciences] [Google Scholar]
- Richards, E.A. 2000, ApJ, 533, 611 [NASA ADS] [CrossRef] [Google Scholar]
- Sadler, E.M., McIntyre, V.J., Jackson, C.A., & Cannon, R.D. 1999, PASP, 16, 247 [Google Scholar]
- Schinnerer, E., Smolčić, V., Carilli, C., et al. 2007, ApJS, 172, 46 [NASA ADS] [CrossRef] [Google Scholar]
- Schinnerer, E., Sargent, M.T., Bondi, M., et al. 2010, ApJS, 188, 384 [NASA ADS] [CrossRef] [Google Scholar]
- Scoville, N., Aussel, H., Brusa, M., et al. 2007, ApJS, 172, 1 [NASA ADS] [CrossRef] [Google Scholar]
- Smolčić, V., Schinnerer, E., Scodeggio, M., et al. 2008, ApJS, 177, 14 [NASA ADS] [CrossRef] [Google Scholar]
- Smolčić, V., Zamorani, G., Schinnerer, E., et al. 2009a, ApJ, 696, 24 [NASA ADS] [CrossRef] [Google Scholar]
- Smolčić, V., Schinnerer, E., Zamorani, G., et al. 2009b, ApJ, 690, 610 [NASA ADS] [CrossRef] [Google Scholar]
- Smolčić, V., Delhaize, J., Huynh, M., et al. 2016, A&A, 592, A10 (XXL Survey, Paper XI) [NASA ADS] [CrossRef] [EDP Sciences] [Google Scholar]
- Smolčić, V., Delvecchio, I., Zamorani, G., et al. 2017a, A&A, 602, A2 [NASA ADS] [CrossRef] [EDP Sciences] [Google Scholar]
- Smolčić, V., Novak, M., Bondi, M., et al. 2017b, A&A, 602, A1 [NASA ADS] [CrossRef] [EDP Sciences] [Google Scholar]
- Sutherland, W., & Saunders, W., 1992 MNRAS, 259, 413 [NASA ADS] [CrossRef] [Google Scholar]
- White, R.L., Becker, R.H., Helfand, D.J., Gregg, M.D. 1997, ApJ, 475, 479 [NASA ADS] [CrossRef] [Google Scholar]
- Windhorst, R.A., Miley, G.K., Owen, F.N., Kron, R.G., & Koo, D.C. 1985, ApJ, 289, 494 [NASA ADS] [CrossRef] [Google Scholar]
- Wright, E.L., Eisenhardt, P.R.M., Mainzer, A.K., et al. 2010, AJ, 140, 1868 [NASA ADS] [CrossRef] [Google Scholar]
All Tables
Results of the identification process using the likelihood ratio technique in seven different bands
Example entries for the catalogue of the optical and NIR counterparts of the radio sources detected in the XXL-S field.
All Figures
|
Fig. 1 Observed magnitude distribution of all optical objects present in the zDec band catalogue within a radius of 3′′ around eachradio source is shown by the black solid histogram. The expected distribution of background objects in the same area n(m) is shown by the blue dashed histogram. The difference between these two distributions (q(m)) is shown by the red dot-dashed histogram. At magnitudes fainter than z = 23.5 the q(m) histogram has negative, unphysical values. |
| In the text | |
|
Fig. 2 Visual representation of the effect that produces negative values at faint magnitudes of the expected probability distribution of the true optical counterparts. The large red circle represents the area used to estimate the observed magnitude distribution around the radio source, whose position is represented by the red cross. Background sources are represented by yellow six-pointed stars and blue five-pointed stars. Due to the presence of a large number of relatively bright optical counterparts (represented in the figure), faint background objects in the area masked by the bright sources (blue five-pointed stars) are not detected. This causes an underestimation of the observed magnitude distribution calculated around the position of the radio sources. |
| In the text | |
|
Fig. 3 Observed magnitude distribution of all optical objects present in the zDec band catalogue within a radius of 3 arcsec around each radio source is shown by the solid black histogram. The expected distribution of background objects in the same area, estimated using the procedure described above, n(m) is shown by the blue dashed histogram. The difference between these two distributions, q(m), is shown by the red dot-dashed histogram |
| In the text | |
|
Fig. 4 Overlap between the position of the optical sources (black tiles) and radio sources (red points). From top left to bottom right the bands are gBCS, gDec, rBCS, rDec, iBCS, iDec, zBCS, and zDec. |
| In the text | |
|
Fig. 5 Overlap between the position of the NIR sources (black tiles) and radio sources (red points). Top left: J band, top right: H band, bottom panel: K band. |
| In the text | |
|
Fig. 6 Top panel: distributionof the separation between the radio source in the XXL-S field and their optical/NIR counterparts. Bottom panel: mag z from the Dec survey vs. separation between the radio source and their optical/NIR counterparts. |
| In the text | |
|
Fig. 7 Top panel: total radio flux distribution for the whole radio sample (black histogram) and for the 4770 radio sources with an optical identification (red histogram). Bottom panel: fraction of identified radio sources as a function of the radio flux. |
| In the text | |
|
Fig. 8 Total radio flux distribution for 1517 radio sources unidentified in the optical and NIR bands. |
| In the text | |
|
Fig. 9 Position of the 1406 unidentified radio sources. |
| In the text | |
|
Fig. 10 Magnitude distributions for the entire optical/NIR samples (solid black line) and for the optical/NIR counterparts of the radio sources (dashed red line) for all the bands considered. |
| In the text | |
|
Fig. 11 Radio-optical-NIR properties of the identified radio sources. Panel a: mag z from the Dec survey vs. the radio flux; panel b: (zDec -K) colour vs. zDec magnitude; panel c: (zDec -K) colour vs. radio flux; panel d: (zDec -K) colour vs. radio-to-optical ratio R. Red symbols show objects with mag zDec > 21.5 (see text fordetails). |
| In the text | |
Current usage metrics show cumulative count of Article Views (full-text article views including HTML views, PDF and ePub downloads, according to the available data) and Abstracts Views on Vision4Press platform.
Data correspond to usage on the plateform after 2015. The current usage metrics is available 48-96 hours after online publication and is updated daily on week days.
Initial download of the metrics may take a while.