Fig. 2
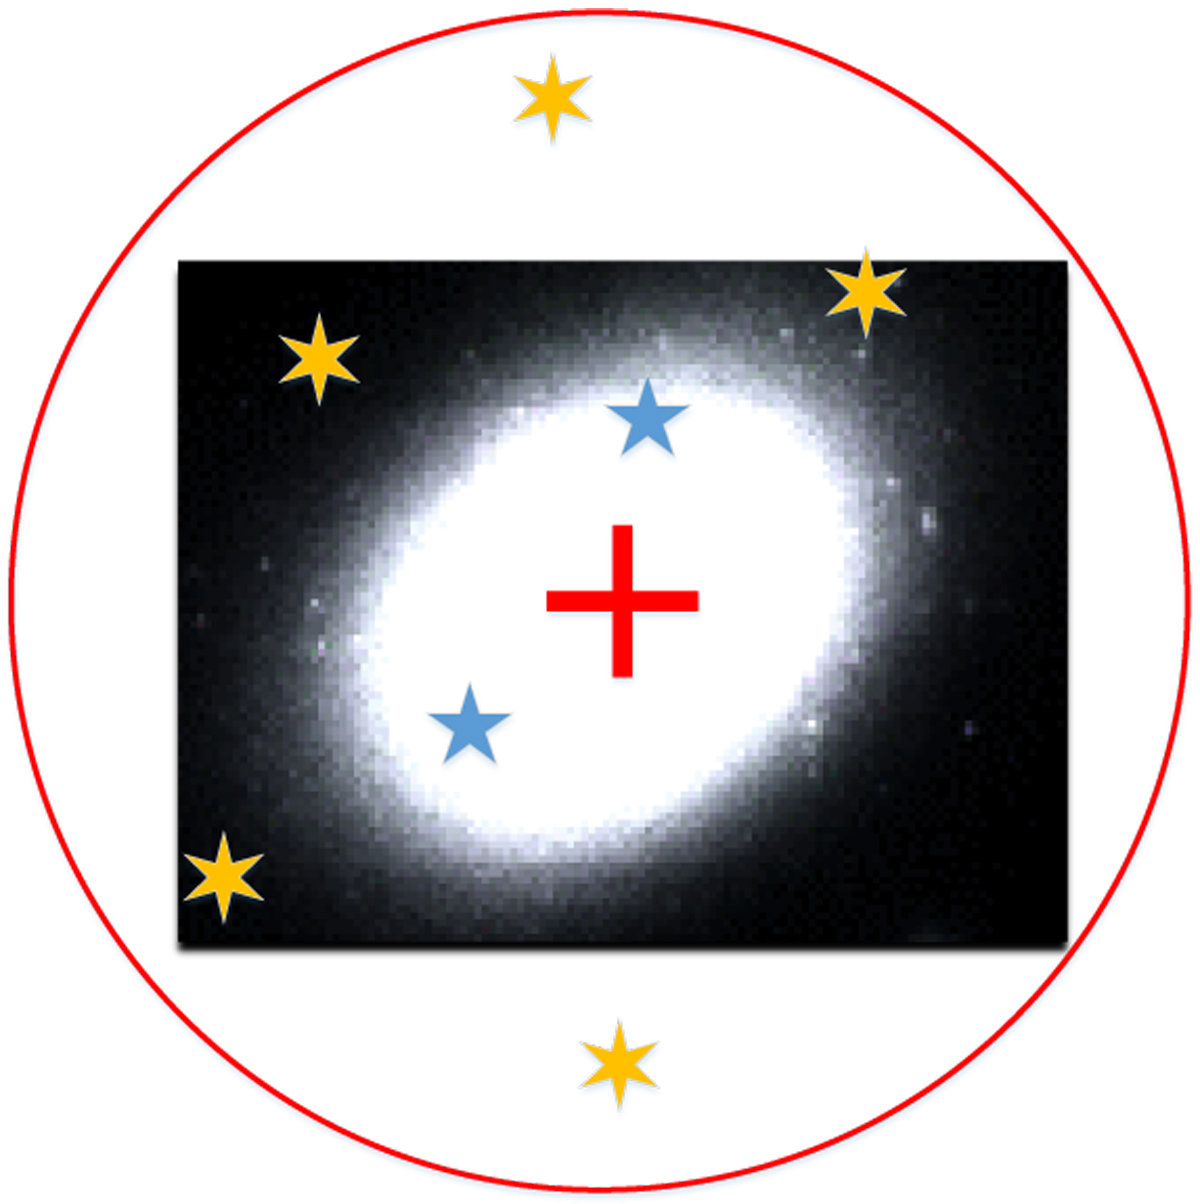
Visual representation of the effect that produces negative values at faint magnitudes of the expected probability distribution of the true optical counterparts. The large red circle represents the area used to estimate the observed magnitude distribution around the radio source, whose position is represented by the red cross. Background sources are represented by yellow six-pointed stars and blue five-pointed stars. Due to the presence of a large number of relatively bright optical counterparts (represented in the figure), faint background objects in the area masked by the bright sources (blue five-pointed stars) are not detected. This causes an underestimation of the observed magnitude distribution calculated around the position of the radio sources.
Current usage metrics show cumulative count of Article Views (full-text article views including HTML views, PDF and ePub downloads, according to the available data) and Abstracts Views on Vision4Press platform.
Data correspond to usage on the plateform after 2015. The current usage metrics is available 48-96 hours after online publication and is updated daily on week days.
Initial download of the metrics may take a while.