Free Access
Fig. 7
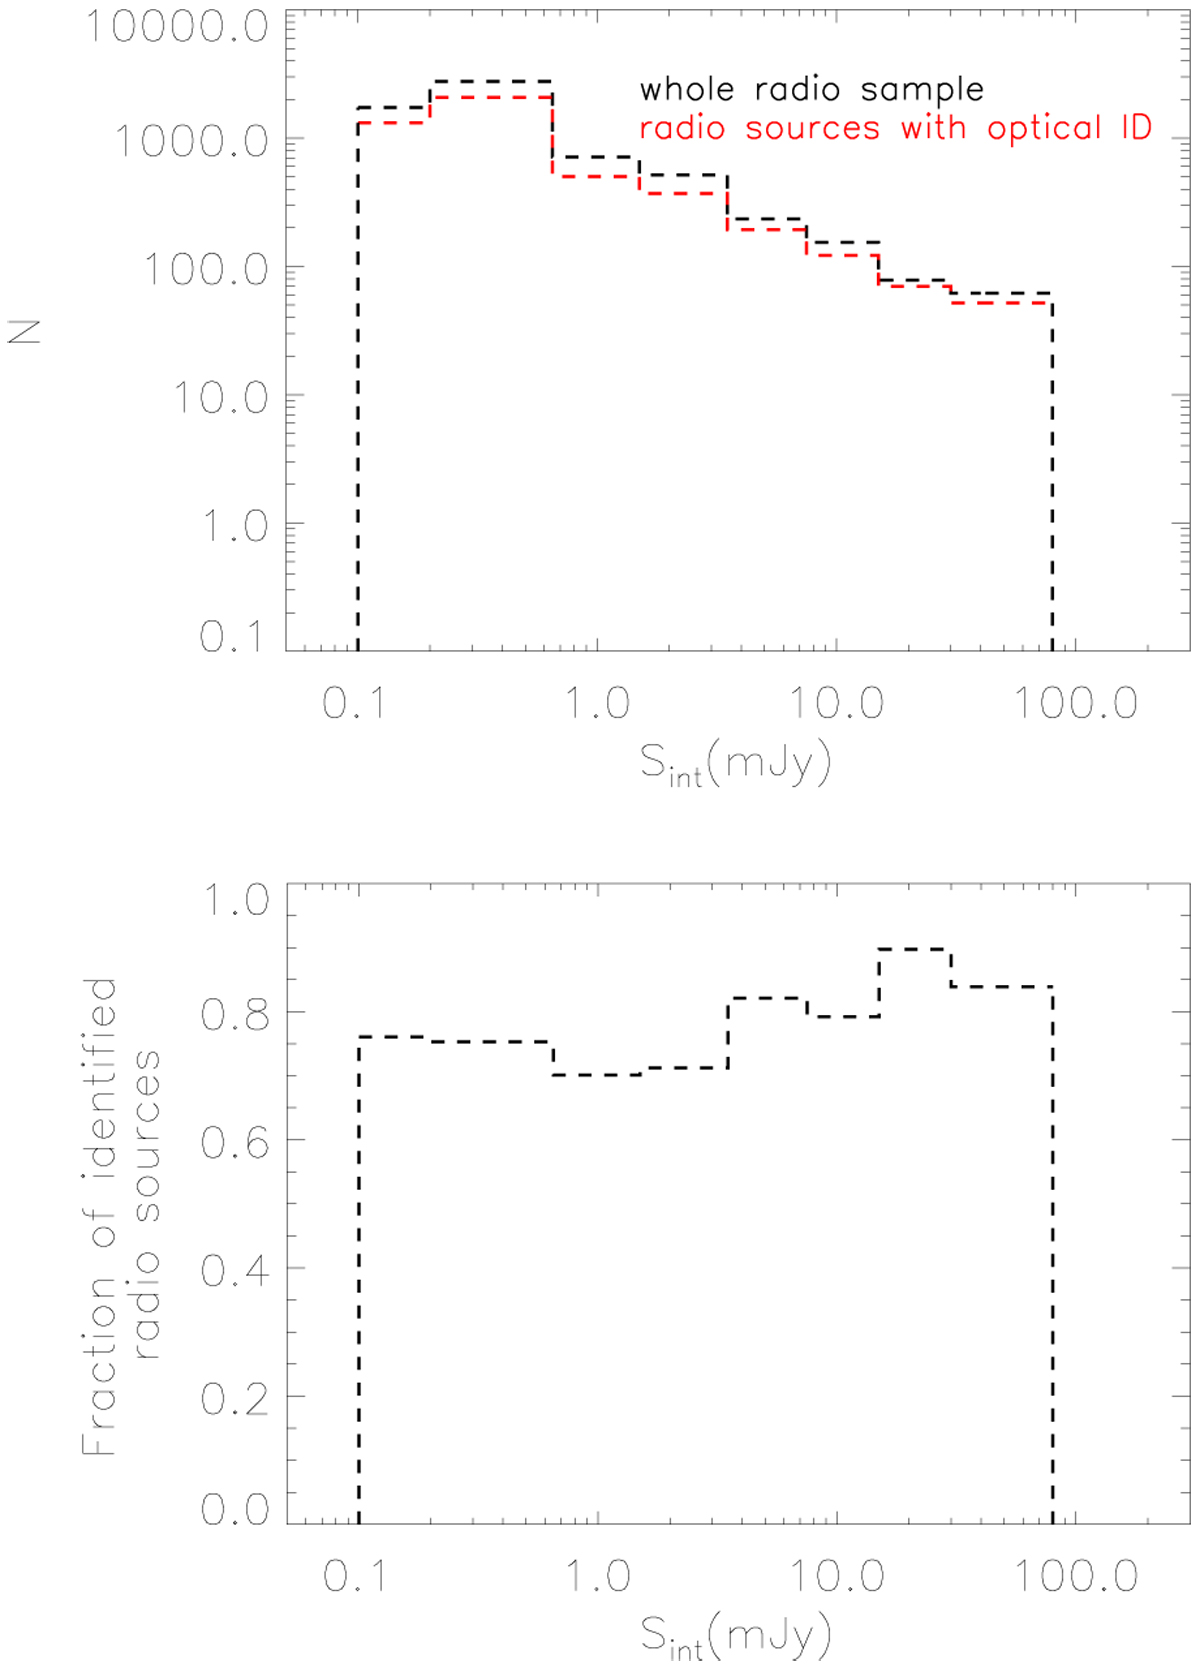
Top panel: total radio flux distribution for the whole radio sample (black histogram) and for the 4770 radio sources with an optical identification (red histogram). Bottom panel: fraction of identified radio sources as a function of the radio flux.
Current usage metrics show cumulative count of Article Views (full-text article views including HTML views, PDF and ePub downloads, according to the available data) and Abstracts Views on Vision4Press platform.
Data correspond to usage on the plateform after 2015. The current usage metrics is available 48-96 hours after online publication and is updated daily on week days.
Initial download of the metrics may take a while.