Fig. 3
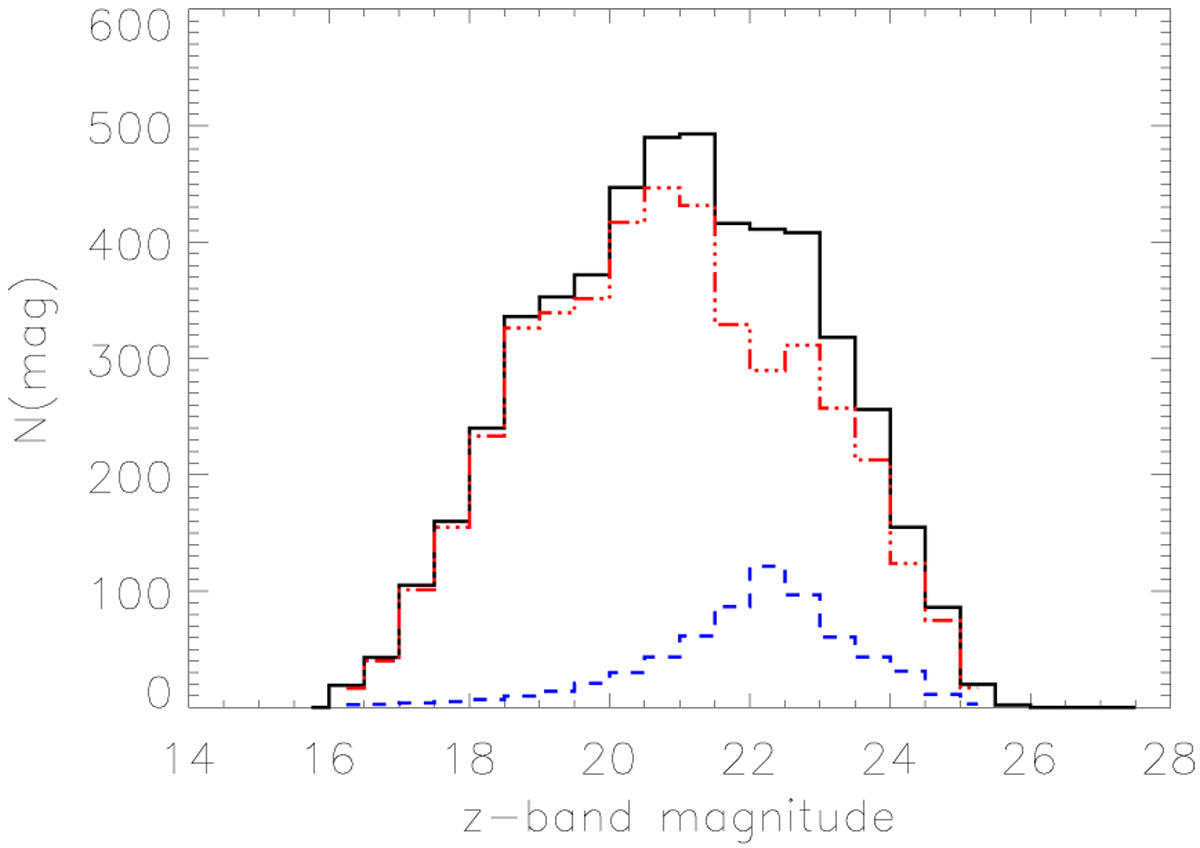
Observed magnitude distribution of all optical objects present in the zDec band catalogue within a radius of 3 arcsec around each radio source is shown by the solid black histogram. The expected distribution of background objects in the same area, estimated using the procedure described above, n(m) is shown by the blue dashed histogram. The difference between these two distributions, q(m), is shown by the red dot-dashed histogram
Current usage metrics show cumulative count of Article Views (full-text article views including HTML views, PDF and ePub downloads, according to the available data) and Abstracts Views on Vision4Press platform.
Data correspond to usage on the plateform after 2015. The current usage metrics is available 48-96 hours after online publication and is updated daily on week days.
Initial download of the metrics may take a while.