Fig. 9.
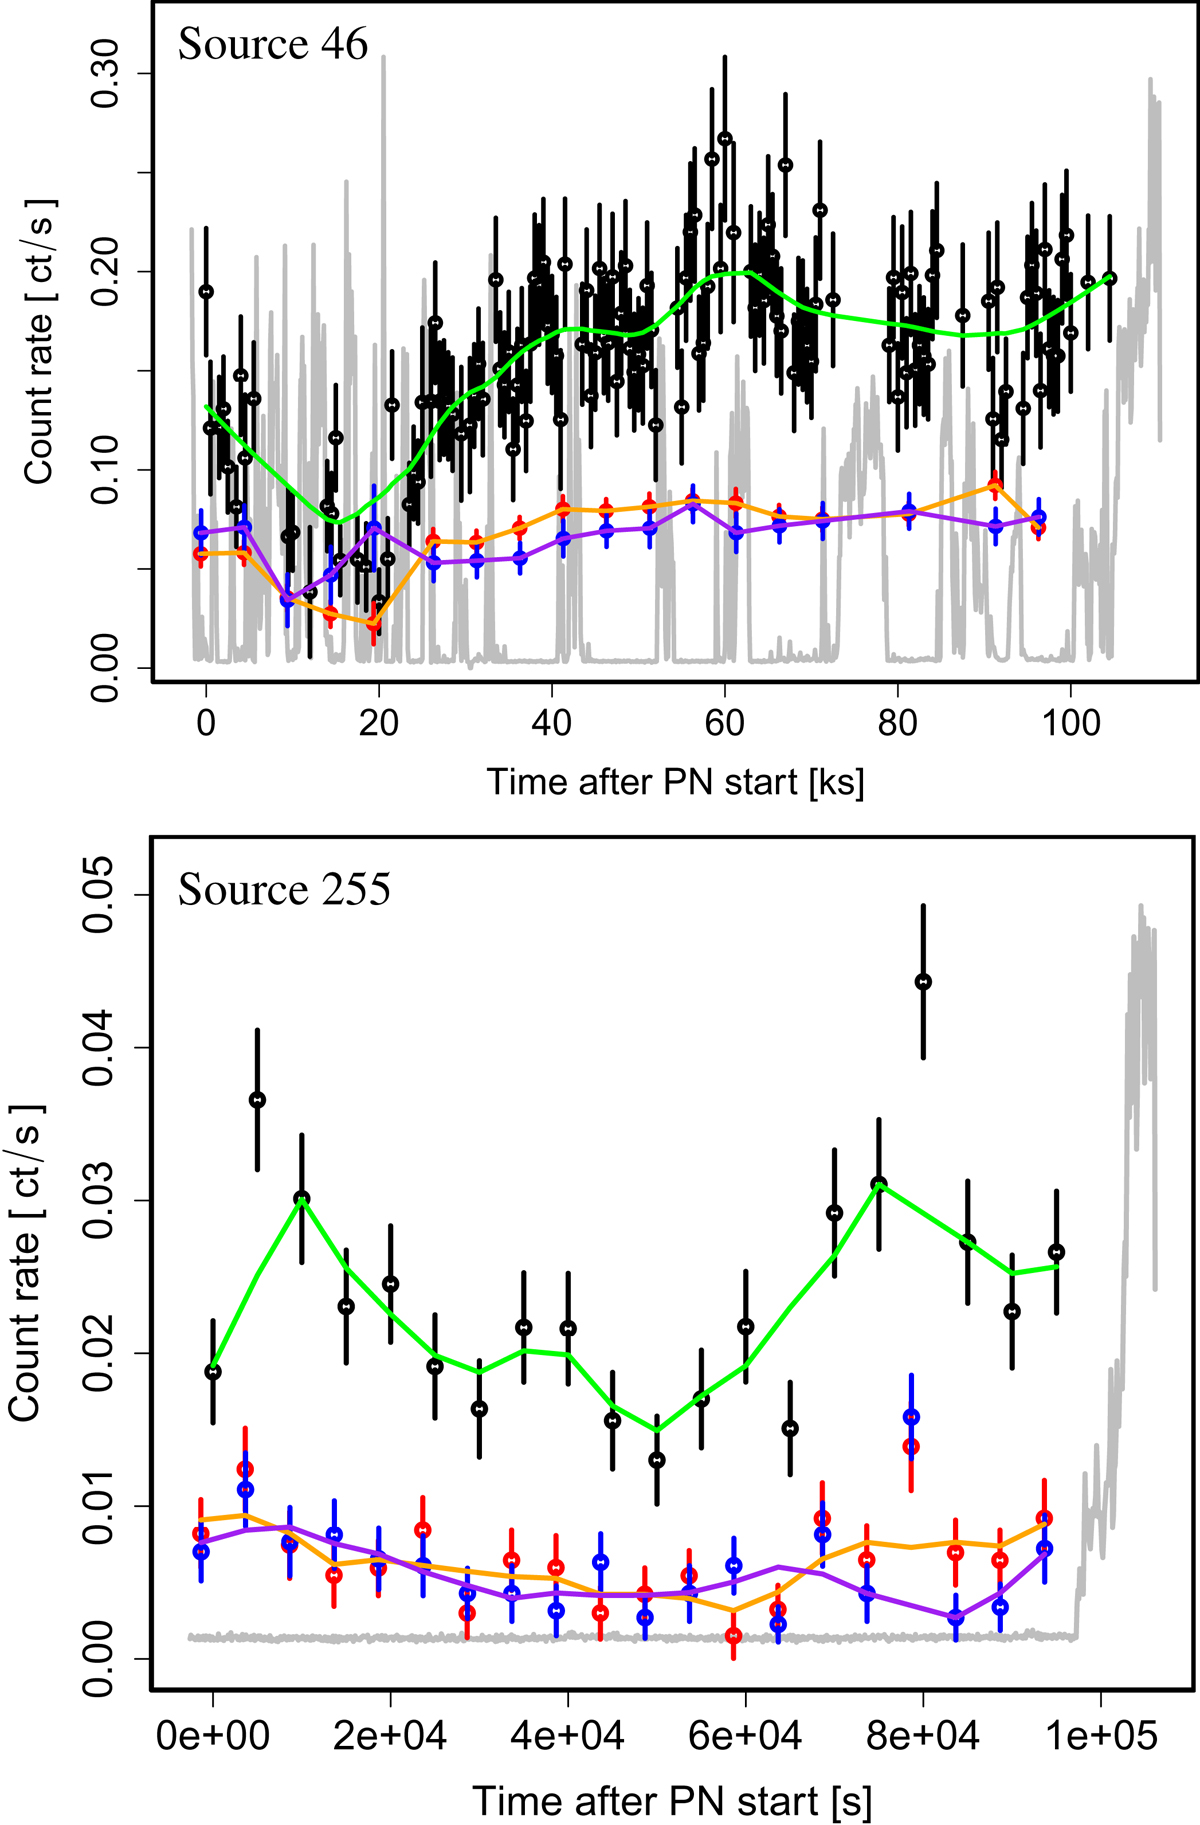
XMM-Newton EPIC light curves of sources 46 and 255 (0.2–5.0 keV), which show variability on short timescales: pn (black), MOS1 (red), and MOS2 (blue) data points are plotted with the corresponding uncertainties. The green (pn), orange (MOS1), and purple (MOS2) curves are smoothing fits. Time resolution was optimised to the source count rate. The grey light curve shows the (scaled pn) background.
Current usage metrics show cumulative count of Article Views (full-text article views including HTML views, PDF and ePub downloads, according to the available data) and Abstracts Views on Vision4Press platform.
Data correspond to usage on the plateform after 2015. The current usage metrics is available 48-96 hours after online publication and is updated daily on week days.
Initial download of the metrics may take a while.