Free Access
Fig. 8.
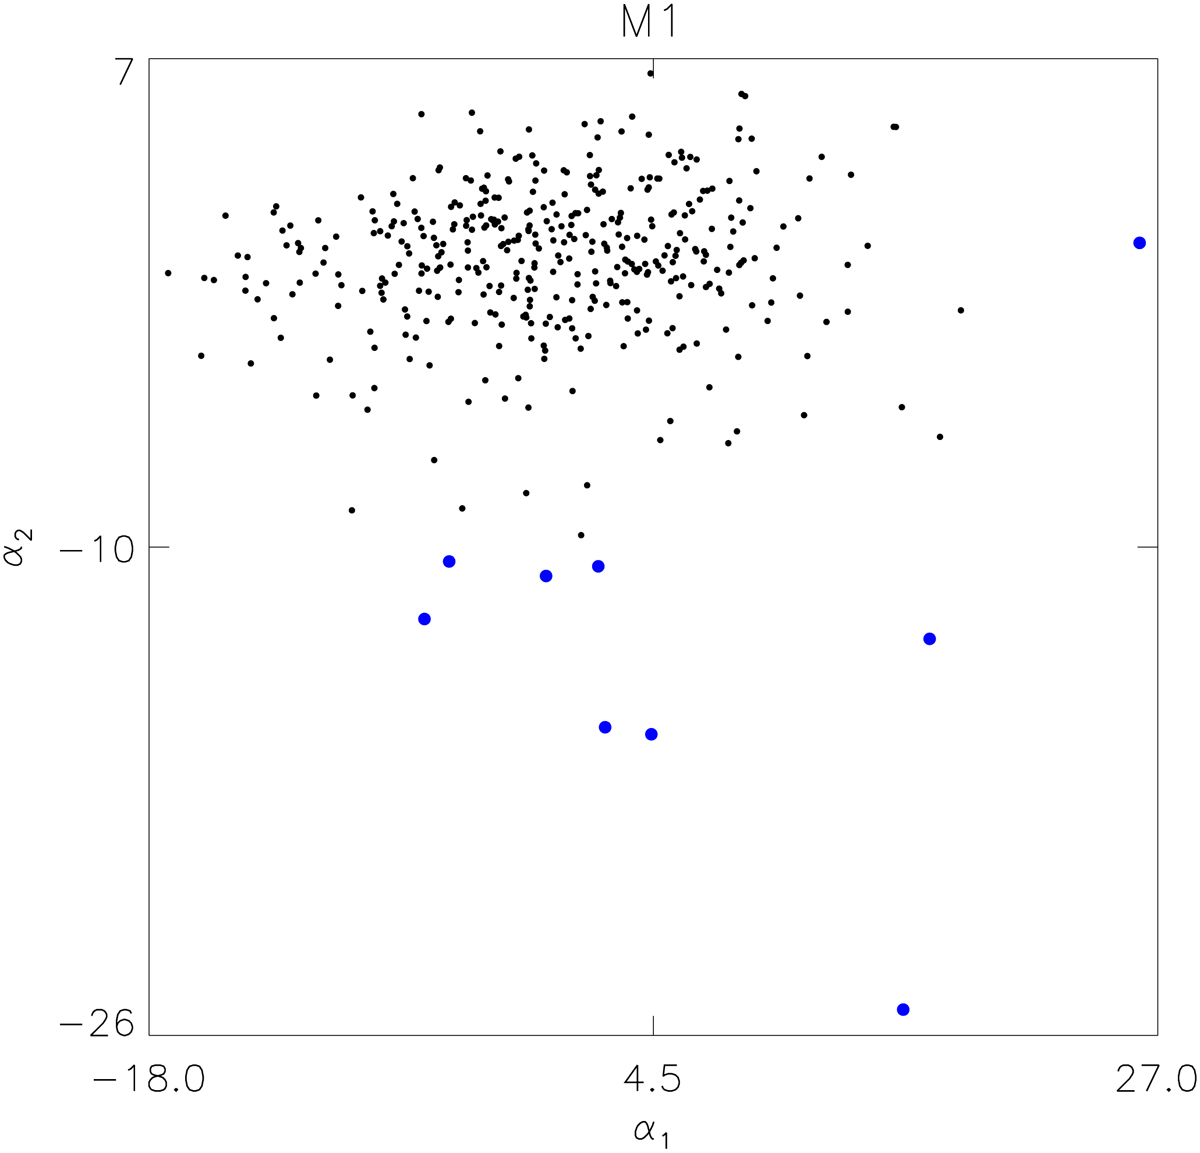
Distribution of the admixture coefficients α1 and α2 of the PCA of MOS1 light curves. This diagram shows the variability on timescales of 1 ks. The sources marked with blue dots show significant variability consistently in all data. In this plot, source 146 appears twice since it was detected in both fields.
Current usage metrics show cumulative count of Article Views (full-text article views including HTML views, PDF and ePub downloads, according to the available data) and Abstracts Views on Vision4Press platform.
Data correspond to usage on the plateform after 2015. The current usage metrics is available 48-96 hours after online publication and is updated daily on week days.
Initial download of the metrics may take a while.