Fig. 7.
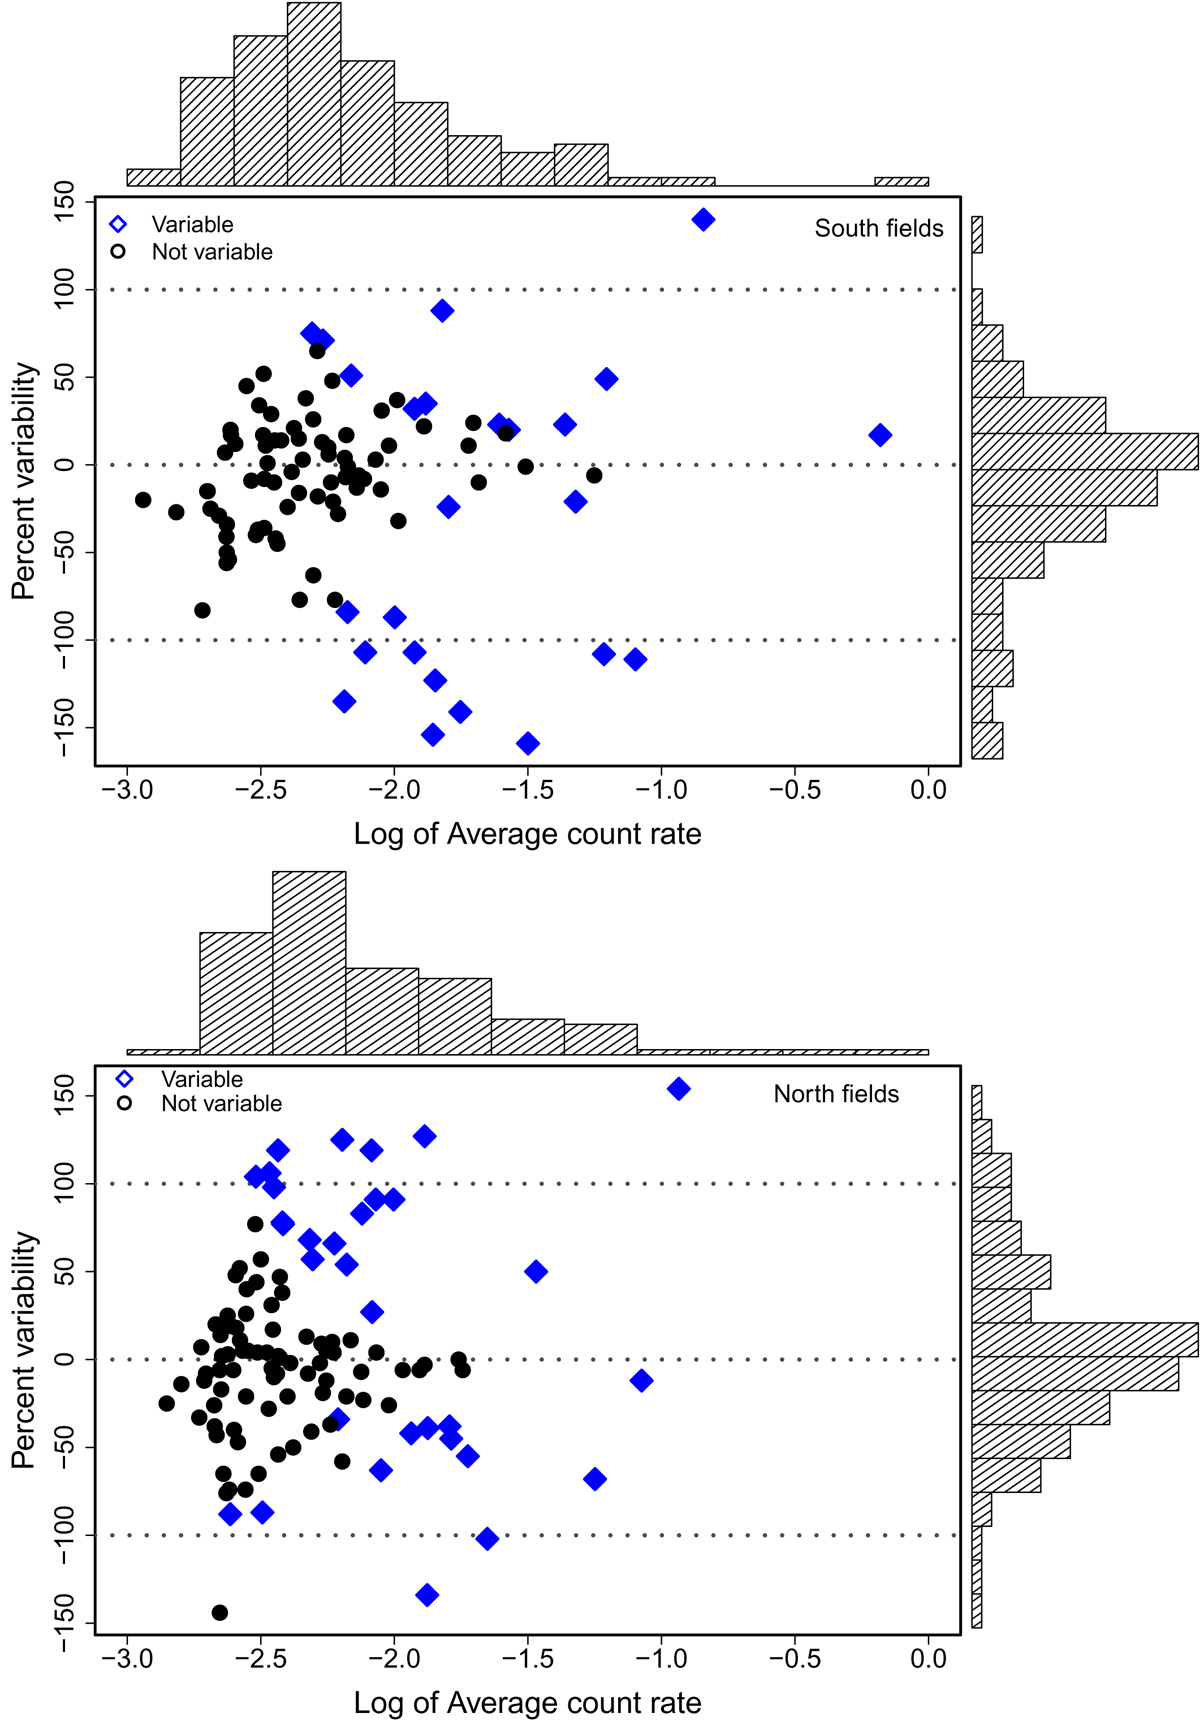
Fractional normalised variability vs. average count rate for all sources detected in each of the two epochs of the south (Field 1, upper panel) and north (Field 2, lower panel) XMM-Newton EPIC fields. These diagrams show the change of flux between two observations, which are about half a year apart. Sources with significant variability are marked with filled blue diamonds. Non-variable sources where the real difference in their count rates is smaller than their (quadratically added) uncertainty are marked with filled black circles. Dashed grey lines mark the zero and 100% variability levels. Marginal histograms show the distributions of average count rates and fractional normalised variability.
Current usage metrics show cumulative count of Article Views (full-text article views including HTML views, PDF and ePub downloads, according to the available data) and Abstracts Views on Vision4Press platform.
Data correspond to usage on the plateform after 2015. The current usage metrics is available 48-96 hours after online publication and is updated daily on week days.
Initial download of the metrics may take a while.