Fig. 5.
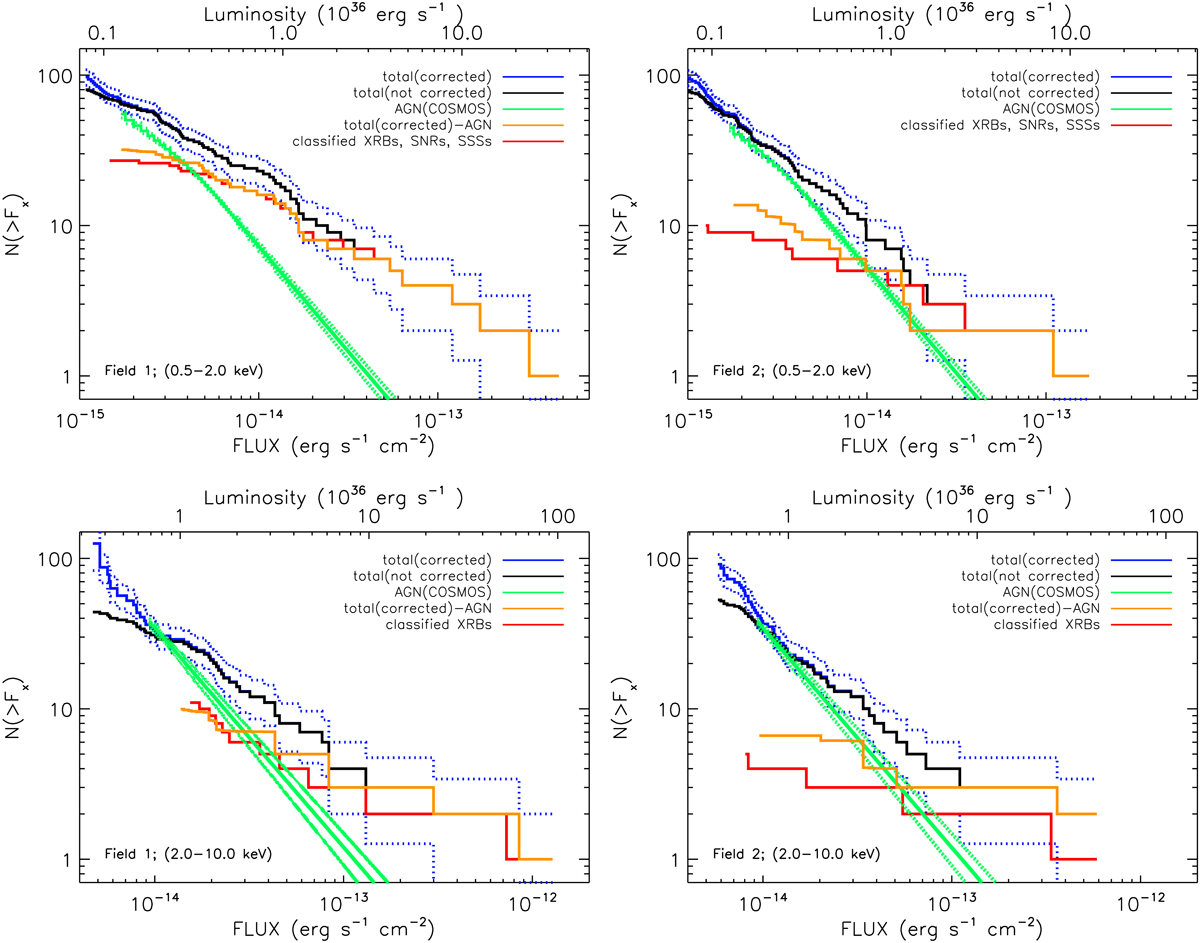
Cumulative X-ray luminosity functions for Fields 1 (left panel) and 2 (right panel) in the bands of 0.5–2.0 keV (upper diagrams) and 2.0–10.0 keV (lower diagrams). The cumulative XLF of all observed sources without foreground stars is shown as black solid line (error ranges with dotted lines), and the XLF that has been incompleteness-corrected is shown as blue lines. The green lines show the estimated contribution of background AGNs in the field based on the study of Cappelluti et al. (2009). The XLF after subtracting the background AGN contribution is shown in orange. The XLF of classified M 31 sources is shown in red.
Current usage metrics show cumulative count of Article Views (full-text article views including HTML views, PDF and ePub downloads, according to the available data) and Abstracts Views on Vision4Press platform.
Data correspond to usage on the plateform after 2015. The current usage metrics is available 48-96 hours after online publication and is updated daily on week days.
Initial download of the metrics may take a while.