Fig. 1.
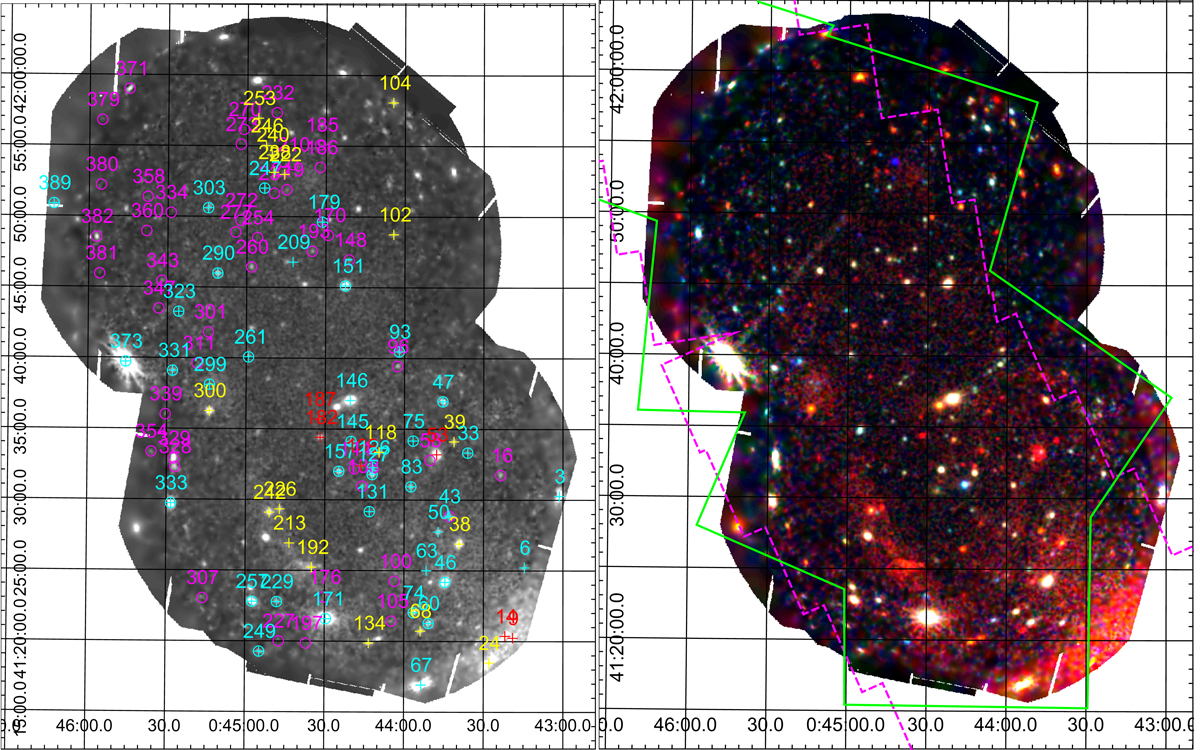
Left: exposure-corrected mosaic image in the energy band 0.2–1.0 keV. Marked sources are: cyan (XRBs and candidates), yellow (SNRs and candidates), red (SSSs and candidates). XRBs and candidates, for which a spectral analysis was performed, are additionally marked with a circle (see Sect. 3.2). Background sources with fitted spectra are marked with magenta circles. Right: exposure-corrected mosaic images of the XMM-Newton LP observations of the northern disc of M 31 in three colours (red: 0.2–1.0 keV, green: 1.0–2.0 keV, blue = 2.0–12.0 keV) with the footprints of the new Chandra survey and the PHAT survey shown by solid green line and dashed magenta line, respectively. All images are shown in log-scale.
Current usage metrics show cumulative count of Article Views (full-text article views including HTML views, PDF and ePub downloads, according to the available data) and Abstracts Views on Vision4Press platform.
Data correspond to usage on the plateform after 2015. The current usage metrics is available 48-96 hours after online publication and is updated daily on week days.
Initial download of the metrics may take a while.