| Issue |
A&A
Volume 620, December 2018
|
|
|---|---|---|
| Article Number | A138 | |
| Number of page(s) | 9 | |
| Section | Interstellar and circumstellar matter | |
| DOI | https://doi.org/10.1051/0004-6361/201833507 | |
| Published online | 10 December 2018 | |
Planetary nebulae with UVIT
II. Revelations from far-UV vision of Butterfly nebula NGC 6302★
1
Indian Institute of Astrophysics,
Koramangala II Block,
Bangalore-560034,
India
e-mail: This email address is being protected from spambots. You need JavaScript enabled to view it.
2
Macquarie University,
NSW,
2109,
Australia
3
Homi Bhabha Centre for Science Education (TIFR),
Mumbai-400088,
India
Received:
26
May
2018
Accepted:
3
October
2018
Abstract
The high excitation planetary nebula, NGC 6302, has been imaged in two far-ultraviolet (FUV) filters, F169M (Sapphire; λeff: 1608 Å) and F172M (Silica; λeff: 1717 Å) and two near-UV (NUV) filters, N219M (B15; λeff: 2196 Å) and N279N (N2; λeff: 2792 Å) with the Ultra Violet Imaging Telescope (UVIT). The FUV F169M image shows faint emission lobes that extend to about 5 arcmin on either side of the central source. Faint orthogonal collimated jet-like structures are present on either side of the FUV lobes through the central source. These structures are not present in the two NUV filters or in the FUV F172M filter. Optical and infrared (IR) images of NGC 6302 show bright emission bipolar lobes in the east-west direction with a massive torus of molecular gas and dust seen as a dark lane in the north-south direction. The FUV lobes are much more extended and oriented at a position angle of 113°. They and the jet-like structures might be remnants of an earlier evolutionary phase, prior to the dramatic explosive event that triggered the Hubble type bipolar flows approximately 2200 years ago. The source of the FUV lobe and jet emission is not known, but is likely due to fluorescent emission from H2 molecules. The cause of the difference in orientation of optical and FUV lobes is not clear and, we speculate, could be related to two binary interactions.
Key words: stars: AGB and post-AGB / stars: winds, outflows / planetary nebulae: general / planetary nebulae: individual: NGC 6302
Based on data obtained with Ultra-Violet Imaging Telescope (UVIT) on satellite ASTROSAT
© ESO 2018
1 Introduction
The object NGC 6302 (PN G349.5+01.0) is a typical bipolar (or possibly multipolar) planetary nebula (PN) discovered by Barnard (1906) as early as 1880 using the 36-inch Lick refractor. He called it the “bug nebula”. It is now well known as the Butterfly nebula. Very detailed Hubble Space Telescope (HST) images have been discussed by Szyszka et al. (2009), who also identified the elusive central star. The optical narrow-band images show two main lobes with a complicated clumpy small-scale structure in the east-west direction, separated by a dark lane of very dense neutral and molecular gas and dust, stretching in the north-south direction. The gas and dust formed into a toroid, which obscures the central star with a visual extinction of about 8 magnitudes (Matsuura et al. 2005; Peretto et al. 2007; Szyszka et al. 2009; Wright et al. 2011). Meaburn et al. (2008) determined the distance to the nebula to be (1.17 ± 0.14) kpc from its expansion parallax found using proper motions of features in the north-west lobe. This estimate seems to be consistent with measurements of proper motions from HST images of the eastern lobe (Szyszka et al. 2011). Wright et al. (2011) used three-dimensional (3D) photoionization modelling of the nebula to derive the properties of the central star. They found it to be hydrogen deficient with a Teff of 220 000 K, log g of 7, L* of 14 300 L⊙, and a mass of 0.73–0.82 M⊙, with an initial mass estimated to be around 5.5 M⊙.
The nebula has been classified as a Type I PN (Peimbert & Torres-Peimbert 1983; Kingsburgh & Barlow 1994), implying high helium and nitrogen abundances. Wright et al. (2011) redetermined the abundances using emission lines from both the lobes that range in ionization from [O I] to [Si IX] and concluded that the high helium (more than that expected for a Type I PN) and very high nitrogen abundance (that showed the sum of C, N, and O to be much larger than the solar value) are a result of the precursor star undergoing a third dredge-up in its earlier evolution.
Extensive studies of the circumstellar torus from IR to radio wavelengths (Lester & Dinerstein 1984; Kemper et al. 2002; Matsuura et al. 2005; Peretto et al. 2007; Santander-García et al. 2017) suggest that the structure is a broken disc containing 2.2 M⊙ of dust and molecular gas expanding with a velocity of 8 km s−1 that was ejected by the star some 5000 yr ago, over a period of about 2000 yr. The torus also obscures both the star and a smaller ionized gas disc (seen in 6 cm free–free continuum) around the star. Kinematic studies of the east-west lobes seem to suggest that an explosive event initiated a kind of Hubble flow (velocity increases outward proportional to the distance away from the star) in both lobes about 2200 yr ago (Meaburn et al. 2008; Szyszka et al. 2009).
The kinematic history of this nebula is complex: according to the modelling by Santander-García et al. (2017), the bulk of the material was ejected and shaped into a ring of material and a set of lobe fragments in an event starting 5000 yr ago. Optical lobes were ejected after a brief delay between 3600 and 4700 yr ago, followed by the large and fast-expanding north-west lobe that was ejected around 2200 yr ago. The new inner ring (in the torus) was ejected at approximately the same time as the NW lobe, 2200 yr ago. As is often the case in collimated nebulae like this one, it cannot be clearly stated whether the bipolar outflow was a resultof disc collimation or whether it resulted from jet-like launching. In this case, the disc may have been able tocollimate the lobes as opposed to, for example, the case of Mz 3 (Smith & Gehrz 2005; Macdonald et al. 2017).
Several possibilities have been suggested for the formation of bipolar nebulae involving single and double stars. In the case of single stars, equatorial discs in the advanced asymptotic giant branch (AGB) phase could shape them after the emergence of fast stellar wind (Balick & Frank 2002; Icke 2003). However, this suggestion has the inherent problem of a lack of enough angular momentum (Soker 2006; Nordhaus & Blackman 2006; García-Segura et al. 2014). In the case of binary stars, the companion can collimate the AGB ejecta into a bipolar structure (Soker 1998), however it is not clear whether all bipolar nebulae are shaped by binary star interactions. In the case of NGC 6302, Peretto et al. (2007) and Wright et al. (2011) provided arguments that the mass loss rate of 5 × 10⁻⁴ M⊙ yr−1 required to produce the massive torus cannot be driven by a single star, but it could easily be accomplished by a binary star. However, no binary companion has been detected so far in the NGC 6302 system. The requirements to produce a NGC 6302-type system seem to demand a hydrogen-deficient, 220 000 K, hot post-AGB star of 0.7–0.8 M⊙ with a companion (presently unseen). The primary must have gone through a third dredge-up phase, and initially ejected 2 M⊙ of gas and dust in the equatorial (or orbital) plane about 5000 yr ago. It later produced a Hubble-type flow through polar lobes by an explosiveevent (the nature of which is unknown) 2200 yr ago. How such a system is produced in the course of stellar evolution of a single or double star is not clear.
In the present paper we report the discovery of faint far-UV (FUV) lobes, much more extended than the optical lobes, with two faint jets in the orthogonal directions on either side of the lobes, as seen in some interacting binary systems. Surprisingly, the FUV lobes are not oriented parallel to the optical lobes (and torus). This may provide clues to the past evolution of the system. The paper is structured as follows: this introduction is followed by our UVIT observations (Sect. 2). The results are presented in Sect. 3 and discussed in Sect. 4. Finally, we offer some concluding remarks in Sect. 5.
2 Observations
Imaging observations of NGC 6302 were obtained with UVIT on 2017 March 18 in four UV filters. UVIT is one of the five payloads on the multi-wavelength Indian astronomical satellite ASTROSAT that was launched on 2015 September 28. It consists of two 38-cm-aperture telescopes, one of which is optimised for the FUV; the other, with a dichroic beam splitter that reflects the near-UV (NUV) and transmits the optical. UVIT provides images in three channels simultaneously: FUV, NUV, and optical, with a 28-arcmin-diameter field of view. The best spatial resolution in the UV bands is about 1.3 arcsec. Each of the UV channels includes fivefilters and one low-resolution transmission grating. The visible channel is used for tracking, with limited scientific utility. Details of the instrument are provided in Kumar et al. (2012) and the in-orbit performance is described in Tandon et al. (2017b).
The present observations of NGC 6302 were obtained in two FUV filters: F169M (Sapphire; λeff: 1608 Å) and F172M (Silica; λeff: 1717 Å) as well as in two NUV filters: N219M (B15; λeff: 2196 Å) and N279N (N2; λeff: 2792 Å). The effective exposure times that went into constructing the images in various filters are the following: 686 s in F169M, 622 s in F172M, 930 s in N219M and 509 s in the N279N. The stellar images in N279N and F169M filters show a PSF of 1.4 arcsec. These observations are complemented with weak exposures in the F154W (BaF2: λeff of 1541 Å) and NUV grating.
In its standard operating mode, UVIT will take images of the sky with a frame rate of 29 s−1, which are stored on board and then sent to the Indian Space Science Data Centre (ISSDC), where the data are written into instrument-specific Level 1 data files. Murthy et al. (2017) have written a set of procedures (JUDE) to read the Level 1 data, extract the photon events from each frame, correct for spacecraft motion (image registration), and add into an image. We used astrometry.net (Lang et al. 2010) for an astrometric calibration and Rahna et al. (2017) and Tandon et al. (2017a), for a photometriccalibration. We have co-added the individual images and placed them all on a common reference frame and these were used for our scientific analysis.
Figure 1 shows the International Ultraviolet Explorer (IUE) spectra of NGC 6302 in the FUV (short wavelength; top panel) and the NUV (long wavelength; bottom panel) at three positions in the nebula: the centre of the nebula (blue line – SWP 05211 and LWR 09064), offset by 4′′ east and 9′′ south (red line) and 12′′ east and 6′′ north (blackline). The emission lines decrease in strength appreciably away from the centre. The transmission functions of the filters (on an arbitrary scale) used are shown in green (F169M, N219M) and magenta (F172M, N279N) superposed on the IUE spectra. The F169M filter has a passband of 290 Å and includes mainly high excitation lines due to [N IV] at 1486 Å, C IV at 1550 Å, [Ne IV] at 1601 Å, He II at 1640 Å, [O III] at 1663 Å and N III] at 1760 Å at the centre of the nebula whereas the F172M filter, which has a passband of 125 Å, includes only N III] at 1760 Å. However, the NUV filter N219M has a passband of 270 Å, centred on the interstellar medium (ISM) absorption bump at 2179 Å and does not include any strong emission lines. The IUE spectrum of the nebula, as noted by Feibelman (2001), does not show any interstellar absorption bump, although a reddening of c(Hβ) ~ 1.44 has been estimated for the nebula (Tsamis et al. 2003). The NUV filter N279N has a passband of 90 Å and includes Mg II at 2800 Å (Beintema & Pottasch 1999; Feibelman 2001) and [Mg V] at 2786 Å (Barral et al. 1982) emission lines.
In Fig. 1, one of the offset (red) spectra has been shown scaled to match the [N IV] at 1486 Å emission line in the nebular centre spectrum (blue) to emphasise how the emission lines vary away from the centre (star). The strengths of the emission lines seem to decrease away from the centre. Moreover, the high-excitation emission lines like C IV at 1550 Å weaken much more than the moderate excitation lines. A similar trend is seen with the other offset spectrum (black) as well. The stellar C IV at 1549 Å feature is weakest (as would be expected), while the nebular N III] at 1750 Å emission is the strongest in the offset spectra. He II is less affected, suggesting that it may be a mixture of stellar and nebular emission.
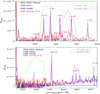 |
Fig. 1 IUE low-resolution nebular spectrum of NGC 6302 (blue line). The FUV range is plotted in the top panel and the NUV range in the bottom panel with UVIT filter effective areas (relative) shown. Top panel: filter F169M (Sapphire; λeff: 1608 Å) is shown with a green curve and filter F172M (Silica; λeff: 1717 Å) is shown in magenta. Bottom panel: NUV filter N219M (B15; λeff: 2196 Å) is shown with a green curve while the filter N279N (N2; λeff: 2792 Å) is shown in magenta. The IUE spectra obtained on the central position (Feibelman 2001) is shown in blue and offset positions are shown in red and black. Line identifications are from Feibelman (2001) and Beintema & Pottasch (1999). The flux of the red spectrum has been multiplied by a constant factor of 2.3 to scale it with the nebular spectrum from the centre on the [N IV] line at 1486 Å. |
3 Results
3.1 Morphological description
In Fig. 2, we present a comparison of images of NGC 6302 in all four UVIT filters. UVIT offers a better spatial resolution than Galex. The image in N279N (Fig. 2, top left) tracks the Mg II 2800 Å line emission and is somewhat similar to the [N II] (and [S II]) images shown in Hua et al. (1998) and Meaburn et al. (2005), but is more extended to the west.
The UVIT N219M image (Fig. 2; top right) is centred on the λ 2200 ISM absorption band. No strong emission lines are present in the NGC 6302 IUE spectrum in this passband. The image is similar to the Galex NUV but the western lobe seems to be much fainter suggesting extinction in that region.
In Fig. 2, bottom panels, the UVIT FUV images are shown. The F172M-filter image (bottom right) includes N III] 1760 Å emission and looks very similar to the [O III] (and Hα) images from Hua et al. (1998). Hua et al. (1998) quote the size of the nebula in various emission lines including [O III] 5007 Å which has dimensions of 60′′ × 185′′. The image in the F169M filter, which includes high-excitation lines (Fig. 1), is expected to be the same size as or smaller than the [O III] image. The inner part of the nebula shown in Fig. 2 (bottom left) of the F169M image is of a similar size to the [O III] image and displays the high-excitation line region.
The enhanced UVIT F169M filter image, however (Fig. 3, top left) shows a different size and appearance. Surprisingly, it shows major extensions that are not present in the optical nebula. The western lobe extends to the north-west like a band with constant width (further discussed in Sect. 3.2).
Both NUV N279N and FUV F169M images show traces of bow-like filamentary structures about 4.5 arcmin west of the nebular centre. However, the intensities of these filaments are marginal and cannot be reliably distinguished from the background without further observations.
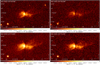 |
Fig. 2 UVITimages of NGC 6302. Top panel: NUV image in the filter N279N on the left and the N219M filter on the right. Bottom panel: FUV images of the filter F169M on the left and images in the filter F172M on the right. |
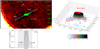 |
Fig. 3 Top left panel: enhanced UVIT image (smoothed and with a higher contrast to show larger and fainter features) of NGC 6302 in F169M filter showing the fainter extensions. The FUV lobes are inclined at an angle to the east-west direction at PA of 113°. The “jets” are almost perpendicular to the FUV lobes. An optical image has been superposed (in green) on the figure for comparison of the size of FUV lobes and jets with the optical nebula. We note that the optical lobes are extended in east-west direction and the torus in north-south. Bottom panel: profiles of crosscuts (in flux density units – erg cm−2 s−1 Å−1 subpix−2 across the white line shown in top left panel) in the filters F169M and F172M. We note the extent of the lobes in the F169M image (blue) relative to that of the F172M image (red). Although the core of the profiles in both filters are of the same extent and are similar to that of optical nebular images, only F169M image has lobes that extend on either side to about 5 arcmin. Top right panel: star-subtracted 3D plot of the F169 image. An optical image(in red) has been superposed for comparison. The eastern and shorter western lobes can be clearly seen in this plot. |
3.2 FUV lobes and jets
The most surprising discovery of our UV observations is the large but faint extended lobe emission (much larger than the optical lobes) in the deeper representation of the F169M-filter image (Fig. 3). In addition, there are two thin, collimated features that we shall refer to as “jets” extending almost perpendicularly to the FUV extended lobes through the centre of the nebula on both sides. The lobes and jets are present only in the F169M filter images but not in the FUV F172M image or in the UVIT and Galex NUV filters. A slightly smoothed negative F169M image is shown in Fig. 3 (top left), where the FUV lobes and jets are compared with the optical [N II] image from Meaburn et al. (2005).
A crosscut (erg cm−2 s−1 Å−1 subpix−2 vs. size) across the images of F169M and F172M (Fig. 3, bottom) shows the extended emission and the presence of lobes in the F169M image compared to the F172M image, although the nebular core emission is similar. The lobes are at a 2σ level above the background. The in-orbit flux calibration from Tandon et al. (2017a) has been used in constructing the flux profiles. It appears that FUV lobes and jets only radiate in the F169M band and at shorter wavelengths.
How real are the FUV lobes and jets? There are no known instrumental artefacts that could create such a pattern. The diffraction pattern expected from the secondary mirror support system is quite different (it has eight uneven ribs) and is not seen even in images of bright stars.
In addition to the F169M image, we have a short exposure (although we specified a long exposure of 1500 s, the satellite operations for some unknown reason only provided 540 s exposure out of which only 400 s was useful) of the nebula through the F154W filter (BaF2). The transmission of the F154W filter is similar to that of F169M but with a broader bandwidth of 380 Å and λeff of 1541 Å extending shortward to 1340 Å (Tandon et al. 2017a). The F154W image shows the presence of FUV lobes and a trace of the northern jet at the same locations as in the F169M image. Therefore, the FUV lobes and jets located at the exact centre of the nebula (and the star) appear to be real and significant.
The deep [N II] 6583 Å image of Hua et al. (1998) displays a bright jet or a filament at the north-north-east edge (Fig. 5) that coincides with the base of the northern FUV jet. It may be no coincidence that they are located almost on top of each other.
The FUV lobes are oriented at an angle of about 23° to the optical lobes. The optical lobes are essentially oriented in the east-west direction with the dark lane torus in the north-south (within ±2°). The FUV lobe are at an average position angle of 113° ± 1°. The mean jet orientation has a position angle of 35° (hence about 12° from the axis perpendicular FUV lobes – not exactly orthogonal). The total extent of the FUV lobes is about 10.25 ± 0.1 arcmin (about 5.12 arcmin from the central bright region). The width of the eastern part is about 1.33 arcmin. The jets extend to a total length of 9.15 arcmin with 4.55 arcmin on either side of the FUV lobes with a width of about 18 ± 2 arcsec. The FUV lobe thickness seems to be more or less constant across the length (until the edge of the NW side – the western part may be slightly more tapered and less thick), suggesting that this lobe is a result of either a collimated flow or a disc of constant thickness.
At a distance of 1.17 kpc, the FUV lobes have a radius of 5.4 × 1018 cm (1.74 pc) with a thickness (width) of 1.4 × 1018 cm (0.45 pc). The jets extends to a physical distance of 4.8 × 1018 cm (1.55 pc) with a thickness of 3.1 × 1017 cm (0.1 pc) on each side.
These dimensions are quite different from those of the optical lobes. Meaburn et al. (2005) find the NW lobe extending to about 3.9 arcmin (1.33 pc) from the centre and the eastern lobe seems to extend to about 1.5 arcmin (0.51 pc) from the centre (Szyszka et al. 2009). The torus, consisting of two rings, extends to a distance of 9 × 1016 cm (inner ring) to 0.95 × 10¹⁷–1.2 × 1017 cm (outer ring) from the centre (Santander-García et al. 2017).
Huggins (2007) discusses the origins of jets and tori in young PNs and pre-PNs. He lists the dimensions of jets and tori around some of the typical systems. The FUV disc and jets of NGC 6302 are much larger than those listed by Huggins (2007; may instead be comparable to the KjPn 8 system).
The contour plots (Figs. 4a–h) show a gradual change in the size of the jets and lobes with flux. The spatial extent of the structures is presented in Table 1, where we list the size as a function of flux level above the background noise. At higher flux levels (2σ; Fig. 4c), the jet size is about 3.6 arcmin. As we start looking at lower flux levels the jet size increases. As we approach the level of the background (0.7σ; Fig. 4c) we can see the full extent of about 9.0 arcmin.
Using the in-orbit flux calibration given in Tandon et al. (2017a), we estimated the total flux in FUV lobes, jets and the core of the nebula in all UV filters (with help of contoured images) as shown in Table 2. The exposure in the F154W filter is too weak to properly estimate the flux in the FUV lobes and jets. These fluxes can be compared with the total nebular fluxes in the optical wavelengths as estimated by Hua et al. (1998). The UV flux estimates have an uncertainty of 10–15%.
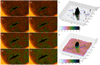 |
Fig. 4 Contour plots of the F169M image at various flux levels. The contours in these figures correspond to a flux above background of panel a: 2.2 σ, panel b: 1.9 σ, panel c: 1.7 σ, panel d: 1.5 σ, panel e: 1.2 σ, panel f: 1.0 σ, panel g: 0.7 σ, and panel h: 0.5 σ. Panel c: we note the beginnings of the jet both to the north as well as the south of the nebula. As we move towards the edge of the jets the flux level falls off with the full extent being visible in panels g and h. Panels e and f: we note that the jet is not homogeneous in flux. Panel i: star-subtracted 3D plot in the flux range mentioned above. The small-extensions are to the north and south of the ones seen in panel c and in Fig. 5. Panel j: similar to the plot above but with a larger range in flux. The entire jet can be seen as a ridge similar to what we see in panel g. |
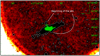 |
Fig. 5 Enhanced F169M image with contours at 4.2 × 10⁻¹⁹ erg cm−2 s−1 Å−1 arcsec−2 (1.7σ; Fig. 4c) superposed (in green) with a deep [N II] image from Hua et al. (1998, Fig. 18b). We note the similarity inshape of the extensions to the north and south of the nebula in the both F169M and [N II] image, though in the F169M image the features are of a larger size. |
Extent of the lobes and jets above various flux levels (background subtracted).
Observed flux of NGC 6302 in various filter bands.
4 Discussion
4.1 What is the source of FUV emission in the large-scale lobes and jets?
The source of FUV emission in the outer parts of the FUV lobes and the jets cannot be attributed to high-excitation emission lines (shownin Fig. 1), which are the dominating source close to the central star and the region occupied by the optical lobes as exemplified by the [O III] images (Hua et al. 1998). Scattering of the stellar spectrum by nebular dust (Mie scattering) is also unlikely, because scattering would be over a wide wavelength range and images in the F172W filter, which is centred about 100 Å longward of F169M (as well as NUV filters), do not show the FUV lobes or the jets as would be instead expected.
The other possibile origin of the FUV F169M filter emission is the Lyman bands of the H2 molecule. H2 from circum-nebular regions has been detected around several PNs (Herald & Bianchi 2011), reflection nebulae IC 63 (Witt et al. 1989), and in FUV rings around the carbon stars U Hya (Sanchez et al. 2015), IRC+10216 (Sahai & Chronopoulos 2010) and CIT 6 (Sahai & Mack-Crane 2014). Ultraviolet fluorescence spectra of H2, as modelled by France et al. (2005) with IC 63, show strong emission blueward of the 1608 Å peak, and no emission longward of 1650 Å. Werner and Lyman bands of H2 extend up to about 900 Å. Since the FUV lobes and jets in NGC 6302 are only present in images using the F169M filter, but not in those using the F172W filter (or in NUV filters), this suggests that H2 emission might be the source. Although weak, the presence of lobes and jets in the F154M images provides additional support for this suggestion. A similar conclusion was arrived at for the FUV halo emission in NGC 40 (Kameswara Rao et al. 2018). Although the central star of NGC 6302 is very hot and luminous, it is still surrounded by 8 mag of visual extinction (as viewed from Earth), due to the dusty torus. Whether sufficient stellar UV flux reaches the ends of the FUV lobes and the jets so as to provide H2 fluorescent emission is not clear, but is possible. Wright et al. (2011) estimate that a large fraction of the central star’s radiation could be escaping through the polar axis (orthogonal to the torus). Ultraviolet extinction through the optical lobes might still not be large enough to block the star light.
Collisional excitation of H2 by hot electrons has been suggested as the source for FUV emission rings seen around carbon stars IRC 10216 and CIT 6 (Sahai & Chronopoulos 2010; Sahai & Mack-Crane 2014). The central stars are too cool. Bow shocks generated from the interactions of cool molecular stellar winds with the ISM provide the hot electrons needed to generate FUV emission.
Collisional excitation of H2 by hot electrons is not very likely in the case of NGC 6302 since no real evidence for strong shocks is seen. Moreover FUV emission in NGC 6302 is morphologically different from the FUV rings around carbon stars. The FUV emission comes from the filled-in lobes and jets in NGC 6302. Hot electrons generated in the shocked regions (stellar wind interaction with the ISM?) have to fill the entire volume of FUV lobes and jets, not only the bow shock regions. Such a major source for the production of electrons is not easily discernible. In such a case it is surprising that no collision line emission (e.g. say from [O I]) is seen from the FUV lobes in the optical spectral range. In case of PNs, the central stars are hot enough to provide the FUV radiation for the H2 fluorescence to be operative.
H2 rotational lines in the IR region from the lobes have been reported by Beintema & Pottasch (1999) in their ISO spectrum. Latter et al. (1995) imaged the nebula in H2 at 2.121 μm, which showed a very similar appearance as the Brackett γ line image and no extension similar to the FUV lobes or jets.
Assuming that the emission from the FUV lobes and jets is due to H2 fluorescence, the total emitted flux from the nebula through the lobes and jets is estimated as follows. Above (in Sect. 3.2), we estimated the observed flux in the FUV lobes and jets through the F169M filter. The interstellar extinction towards NGC 6302 has been estimated to be E(B−V) = 0.99 mag. Correcting the fluxes for interstellar extinction using Seaton’s reddening curve, Seaton (1979), the reddening-free fluxes are 1.72 × 10⁻⁸ and 2.4 × 10⁻⁹ erg cm−2 s−1 for lobes and jets, respectively. The total fluxes emitted by NGC 6302 located at a distance of 1.17 kpc are 2.85 × 1036 and 4.0 × 1035 erg s−1 in the F169M filter for lobes and jets, respectively. It has been generally estimated, in case of H2 fluorescence, that 30% of the flux is emitted in Lyman bands in the wavelength range from 1400 to 1700 Å (Martin et al. 1990), which is appropriate for the F169M filter. The rest of the emission is expected to be in the Werner bands between 940 and 1300 Å. Therefore, the total H2 fluorescent emission by NGC 6302 in FUV lobes and jets is estimated to be 1.0 × 1037 and 1.3 × 1036 erg s−1, respectively. The uncertainty in these estimates is about 30%1.
Hsia et al. (2014) present [N II] images of young multipolar nebulae Hen 2-86 and Hen 2-320 (their class II type) that show two and four pairs of collimated lobes respectively with the same bipolar axis. The ends of each pair of these lobes are well marked by brighter nebular arcs (rings) perpendicular to the lobe axis. Sometimes the inner lobes have a larger width relative to the outer ones. Although the origins of these multilayer bipolar lobes is unclear, one possibility suggested by Hsia et al. (2014) is consecutive ejections collimated by a similar mechanism.
4.2 How are FUV lobes related to the optical nebula?
Meaburn et al. (2008) determined an age of the northwestern optical lobe of 2200 yr from proper motion studies. By modelling the spatio-kinematic structure observed in the HST images using the SHAPE program, Santander-García et al. (2017) estimated the kinematic age of the wide lobes to be between 3600 and 4700 yr. On the other hand, from proper motion studies of the HST images of the eastern lobe, Szyszka et al. (2011) determined an age of 2200 yr, in line with the conclusion of Meaburn et al. (2008), from which one can conclude that the Hubble-type flow seen in both eastern and northwestern lobes might be the result of the same explosive event triggered ~2200 yr ago.
The massive molecular ring (not seen in the optical images) that constitutes the torus was formed between 3000 and 5000 yr ago, according to the modelling studies of Santander-García et al. (2017), after which the perpendicular optical lobes were ejected. According to their scenario, two major ejection events have happened to the AGB star that produced NGC 6302: the formation of the torus and the formation of the lobes (the Hubble flow). The photoionisation models of Wright et al. (2011) suggest that the central star left the AGB stage some 2100 yr ago, in agreement with the time of the optical lobe ejection event.
While it is not easy to find a perfect scenario to fit our knowledge of the optical nebula, it is likely that a binary interaction ejected a large circumbinary disc (the molecular torus) during a phase of unstable Roche lobe overflow. That phase then proceeded to a common envelope event, possibly even one resulting in a merger and it is that event which produced a second ejection interacting with the disc. The overall shape would then have been ploughed by the fast ionising wind, resulting in the optical nebula. Since quantitative theoretical knowledge is scarce (see e.g. Nordhaus & Blackman 2006), this scenario is plausible. The story, however, becomes far more complex, even for a qualitative scenario, when we add the information provided by the large FUV structures.
Since we do not have any kinematic information of the FUV lobes and jets, we cannot estimate their age. However, solely based on their larger size, they are likely older than the optical nebula.
The typical velocity of jets in bipolar systems is about 100–200 km s−1 and tori are known to expand at about 10 km s−1 (Huggins 2007). If we assume that a velocity of 160 km s−1 characterises the FUV lobes as well as the jets, their ages would be 10 600 and 9500 yr, respectively. This estimate, although uncertain, is much older than the ages of the optical lobes and of the torus and would indicate that the FUV lobes and jets represent an earlier event.
The orientation of the FUV lobes and jets with respect to the axis of the optical nebula may present further clues (Fig. 3). Furthermore, we note that the axis of the FUV lobes is not the same as the long axis of the optical nebula (it is tilted ~23°±1° anticlockwise with respect to the long axis of the optical nebula), although one could argue that the NW FUV lobe seems aligned with the longest protrusion of the optical western lobe.
Another feature of the FUV lobes (and particularly of the eastern lobe) is that they have the same width throughout their length, suggesting a certain type of collimation. On the other hand, the optical lobes have a wide opening angle and have a Hubble-type characteristic with a radial expansion from the central star (shown by the proper motion vectors of Fig. 9 in Szyszka et al. 2011). It is highly unlikely that the FUV lobes are a similar Hubble-type flow.
These characteristics are not immediately explainable, though taken in groups they can be found in other nebulae. For example, several quadrupolar and multipolar nebulae have been suggested as examples of cases where there is a change of orientation in the ejection (Manchado et al. 1996). These lobes are thought to be ejections at different times in the course of a precession cycle of the rotation axis of the central star in a binary system. Manchado et al. (1996) estimated, in PN M2-46, that the rotation axis has changed by 53° between two ejections of the lobes (see their Fig. 5) In the case of NGC 6302, the axis seems to have changed by 67°. Similarly, the ejection type is clearly different (radial Hubble-type flow vs. cylindrical and likely not Hubble-type).
The stage of evolution of an AGB binary at which these ejections take place is not clear. If we assume that the optical nebula and the molecular torus were ejected one after the other during the AGB life of the progenitor, the FUV structures would have been ejected earlier, but why? Could the system have been a triplet where the older ejection (FUV structures) was caused by an inner companion (a merger that did not terminate the AGB life of the star) and the later ejection was caused by a companion farther out, reached by the continually expanding AGB star? And if so, how was the older ejection accomplished? And how can two sets of perpendicular lobes and jets be generated?
Another way to produce two distinct interaction events, and possibly two nebulae, at a distance of a few thousand years could be related with a post-AGB final helium shell flash (De Marco 2008). This would also be in line with the hydrogen-deficient nature of the central star (Wright et al. 2011): a common envelope event took place that terminated the life of the AGB star (first ejection producing the FUV nebula) and a close binary star surrounded by a nebula. Subsequently, a second outburst, a last helium shell flash, would have likely lead to the expansion of the primary, leading immediately to a merger with the close companion and possibly the second (optical) nebula. This is a plausible scenario since post-CE binaries exist in the core of PNs (Hillwig et al. 2016) and we know that about 20% of all post-AGB stars suffer a last helium shell flash (Werner & Herwig 2006). This scenario is qualitative and does not necessarily explain all the data – the orientation of the ejecta remains a mystery, as does the reason for the outer nebula to be so faint and only seen in FUV; however, its broad characteristics are in line with a double outburst, something that is generally difficult to obtain.
Although the origin of collimated outflows and jets is quite uncertain, most often they are linked to interactions within binary systems involving magnetic fields and accretion processes (Soker & Livio 1994; Reyes-Ruiz & López 1999; Soker 1998, 2006; Nordhaus & Blackman 2006; Blackman & Lucchini 2014; Tocknell et al. 2014). In some cases these ejections could be quite explosive, generating Hubble-type ejecta. Soker & Kashi (2012) invoke similarities in the properties of optical lobes and the torus of NGC 6302 with intermediate-luminosity optical transients (ILOTs) which are explosive events with energies intermediate between novae and supernovae (Kasliwal et al. 2011).
The FUV lobes and jets of NGC 6302 seem to share some characteristics with young multipolar collimated lobe systems like those in Hen 2-320, OH 231.8+4.2, or IC 4406, but are five to ten times larger in size. Clearly the diversity of initial conditions offered by binary and triple systems leaves a maze of possible structures that, particularly in light of an incomplete theoretical understanding of mass transfer, makes for a very confusing landscape.
5 Concluding remarks
UVIT images of the young butterfly nebula NGC 6302 reveal dramatic large FUV lobes and orthogonally placed jets that remain unseen at optical wavelengths. FUV lobes are much larger than the optical lobes. These new structures add to the complexity of structures already seen in the optical. This begs the questions of whether or not FUV and optical structures need a binary central star. The source of FUV emission shortward of the F169M filter bandpass is not known but is most likely fluorescent emission of the H2 molecule. Substantial mass might be hidden in the unseen H2. Ultraviolet absorption line (and extinction) studies of background stars through these FUV lobes might help in estimating their total mass. Deep far-IR images might show cold dust associated with these FUV lobes.
Such FUV emission structures may not be uncommon features of young PNs. UVIT images of NGC 40 have already shown a FUV halo (Kameswara Rao et al. 2018). Another bipolar (multipolar) nebula, NGC 2440, also shows FUV extensions and a jet beyond the optical (and NUV) nebula (Kameswara Rao et al., in prep.). UVIT on ASTROSAT with its angular resolution (~1.4′′) comparable to ground-based imagery and its high sensitivity is well suited to mapping such FUV structures that, until now, have remained hidden.
Acknowledgements
UVIT and ASTROSAT observatory development took about two decades before launch. Several people from several agencies were involved in this effort. We would like to thank them all collectively. N.K.R. and K.S. would like to thank the Department of Science and Technology for their support through grant SERB/F/2143/2016-17 “Aspects in Stellar and Galactic Evolution”. A.R. acknowledges Raja Ramanna Fellowship of Department of Atomic energy for the support. N.K.R. would like to thank Dr. George Koshy for his help in estimating the total flux in the lobes. Some of the data presented in this paper were obtained from the Mikulski Archive for Space Telescopes (MAST). STScI is operated by the Association of Universities for Research in Astronomy, Inc., under NASA contract NAS5-26555. Support for MAST for non-HST data is provided by the NASA Office of Space Science via grant NNX09AF08G and by other grants and contracts.
References
- Balick, B., & Frank, A. 2002, ARA&A, 40, 439 [NASA ADS] [CrossRef] [Google Scholar]
- Barnard, E. E. 1906, Astron. Nachr., 173, 123 [NASA ADS] [CrossRef] [Google Scholar]
- Barral, J. F., Cantó, J., Meaburn, J., & Walsh, J. R. 1982, MNRAS, 199, 817 [NASA ADS] [CrossRef] [Google Scholar]
- Beintema, D. A., & Pottasch, S. R. 1999, A&A, 347, 942 [NASA ADS] [Google Scholar]
- Blackman, E. G., & Lucchini, S. 2014, MNRAS, 440, L16 [NASA ADS] [CrossRef] [Google Scholar]
- De Marco O. 2008, in Hydrogen-Deficient Stars, eds. A. Werner & T. Rauch, ASP Conf. Ser., 391, 209 [NASA ADS] [Google Scholar]
- Feibelman, W. A. 2001, ApJ, 550, 785 [NASA ADS] [CrossRef] [Google Scholar]
- France, K., Andersson, B.-G., McCandliss, S. R., & Feldman, P. D. 2005, ApJ, 628, 750 [NASA ADS] [CrossRef] [Google Scholar]
- García-Segura, G., Villaver, E., Langer, N., Yoon, S.-C., & Manchado, A. 2014, ApJ, 783, 74 [NASA ADS] [CrossRef] [Google Scholar]
- Gómez, E. A. 2013, A&A, 558, A107 [NASA ADS] [CrossRef] [EDP Sciences] [Google Scholar]
- Herald, J. E., & Bianchi, L. 2011, MNRAS, 417, 2440 [NASA ADS] [CrossRef] [Google Scholar]
- Hillwig, T. C., Jones, D., De Marco, O., et al. 2016, ApJ, 832, 125 [NASA ADS] [CrossRef] [Google Scholar]
- Hsia, C.-H., Chau, W., Zhang, Y., & Kwok, S. 2014, ApJ, 787, 25 [NASA ADS] [CrossRef] [Google Scholar]
- Hua, C. T., Dopita, M. A., & Martinis, J. 1998, A&AS, 133, 361 [NASA ADS] [CrossRef] [EDP Sciences] [Google Scholar]
- Huggins, P. J. 2007, ApJ, 663, 342 [NASA ADS] [CrossRef] [Google Scholar]
- Icke, V. 2003, A&A, 405, L11 [NASA ADS] [CrossRef] [EDP Sciences] [Google Scholar]
- Kameswara Rao, N., Sutaria, F., Murthy, J., et al. 2018, A&A, 609, L1 [NASA ADS] [CrossRef] [EDP Sciences] [Google Scholar]
- Kasliwal, M. M., Kulkarni, S. R., Arcavi, I., et al. 2011, ApJ, 730, 134 [NASA ADS] [CrossRef] [Google Scholar]
- Kemper, F., Molster, F. J., Jäger, C., & Waters, L. B. F. M. 2002, A&A, 394, 679 [NASA ADS] [CrossRef] [EDP Sciences] [Google Scholar]
- Kingsburgh, R. L., & Barlow, M. J. 1994, MNRAS, 271, 257 [NASA ADS] [CrossRef] [Google Scholar]
- Kumar, A., Ghosh, S. K., Hutchings, J., et al. 2012, in Space Telescopes and Instrumentation 2012: Ultraviolet to Gamma Ray, Proc. SPIE, 8443 [Google Scholar]
- Lang, D., Hogg, D. W., Mierle, K., Blanton, M., & Roweis, S. 2010, AJ, 139, 1782 [Google Scholar]
- Latter, W. B., Kelly, D. M., Hora, J. L., & Deutsch, L. K. 1995, ApJS, 100, 159 [NASA ADS] [CrossRef] [Google Scholar]
- Lester, D. F., & Dinerstein, H. L. 1984, ApJ, 281, L67 [NASA ADS] [CrossRef] [Google Scholar]
- Macdonald, D., De Marco, O., Lagadec, E., Ma, J., & Chesneau, O. 2017, ArXiv e-prints [arXiv:1705.00120] [Google Scholar]
- Manchado, A., Stanghellini, L., & Guerrero, M. A. 1996, ApJ, 466, L95 [NASA ADS] [CrossRef] [Google Scholar]
- Martin, C., Hurwitz, M., & Bowyer, S. 1990, ApJ, 354, 220 [NASA ADS] [CrossRef] [Google Scholar]
- Matsuura, M., Zijlstra, A. A., Molster, F. J., et al. 2005, MNRAS, 359, 383 [NASA ADS] [CrossRef] [Google Scholar]
- Meaburn, J., López, J. A., Steffen, W., Graham, M. F., & Holloway, A. J. 2005, AJ, 130, 2303 [NASA ADS] [CrossRef] [Google Scholar]
- Meaburn, J., Lloyd, M., Vaytet, N. M. H., & López, J. A. 2008, MNRAS, 385, 269 [NASA ADS] [CrossRef] [Google Scholar]
- Murthy, J., Rahna, P. T., Sutaria, F., et al. 2017, A&C, 20, 120 [NASA ADS] [Google Scholar]
- Nordhaus, J., & Blackman, E. G. 2006, MNRAS, 370, 2004 [NASA ADS] [CrossRef] [Google Scholar]
- Peimbert, M., & Torres-Peimbert, S. 1983, in Planetary Nebulae, ed. D. R. Flower, IAU Symp., 103, 233 [NASA ADS] [CrossRef] [Google Scholar]
- Peretto, N., Fuller, G., Zijlstra, A., & Patel, N. 2007, A&A, 473, 207 [NASA ADS] [CrossRef] [EDP Sciences] [Google Scholar]
- Rahna, P. T., Murthy, J., Safonova, M., et al. 2017, MNRAS, 471, 3028 [NASA ADS] [CrossRef] [Google Scholar]
- Reyes-Ruiz, M., & López, J. A. 1999, ApJ, 524, 952 [NASA ADS] [CrossRef] [Google Scholar]
- Sahai, R., & Chronopoulos, C. K. 2010, ApJ, 711, L53 [NASA ADS] [CrossRef] [Google Scholar]
- Sahai, R., & Mack-Crane, G. P. 2014, AJ, 148, 74 [NASA ADS] [CrossRef] [Google Scholar]
- Sanchez, E., Montez, Jr. R., Ramstedt, S., & Stassun, K. G. 2015, ApJ, 798, L39 [NASA ADS] [CrossRef] [Google Scholar]
- Santander-García, M., Bujarrabal, V., Alcolea, J., et al. 2017, A&A, 597, A27 [NASA ADS] [CrossRef] [EDP Sciences] [Google Scholar]
- Seaton, M. J. 1979, MNRAS, 187, 73P [NASA ADS] [CrossRef] [Google Scholar]
- Smith, N., & Gehrz, R. D. 2005, AJ, 129, 969 [NASA ADS] [CrossRef] [Google Scholar]
- Soker, N. 1998, ApJ, 496, 833 [NASA ADS] [CrossRef] [Google Scholar]
- Soker, N. 2006, PASP, 118, 260 [NASA ADS] [CrossRef] [Google Scholar]
- Soker, N., & Kashi, A. 2012, ApJ, 746, 100 [NASA ADS] [CrossRef] [Google Scholar]
- Soker, N., & Livio, M. 1994, ApJ, 421, 219 [NASA ADS] [CrossRef] [Google Scholar]
- Szyszka, C., Walsh, J. R., Zijlstra, A. A., & Tsamis, Y. G. 2009, ApJ, 707, L32 [NASA ADS] [CrossRef] [Google Scholar]
- Szyszka, C., Zijlstra, A. A., & Walsh, J. R. 2011, MNRAS, 416, 715 [NASA ADS] [Google Scholar]
- Tandon, S. N., Subramaniam, A., Girish, V., et al. 2017a, AJ, 154, 128 [NASA ADS] [CrossRef] [Google Scholar]
- Tandon, S. N., Hutchings, J. B., Ghosh, S. K., et al. 2017b, JApA, 38, 28 [NASA ADS] [Google Scholar]
- Tocknell, J., De Marco, O., & Wardle, M. 2014, MNRAS, 439, 2014 [NASA ADS] [CrossRef] [Google Scholar]
- Tsamis, Y. G., Barlow, M. J., Liu, X.-W., Danziger, I. J., & Storey, P. J. 2003, MNRAS, 345, 186 [NASA ADS] [CrossRef] [Google Scholar]
- Werner, K., & Herwig, F. 2006, PASP, 118, 183 [NASA ADS] [CrossRef] [Google Scholar]
- Witt, A. N., Stecher, T. P., Boroson, T. A., & Bohlin, R. C. 1989, ApJ, 336, L21 [NASA ADS] [CrossRef] [Google Scholar]
- Wright, N. J., Barlow, M. J., Ercolano, B., & Rauch, T. 2011, MNRAS, 418, 370 [NASA ADS] [CrossRef] [Google Scholar]
Gómez (2013) causally suggests neutral C excitation through inelastic collisions of 3P-1D transitions might provide FUV emission – but we are not sure that this would work here (might contribute to a minor extent?).
All Tables
All Figures
|
Fig. 1 IUE low-resolution nebular spectrum of NGC 6302 (blue line). The FUV range is plotted in the top panel and the NUV range in the bottom panel with UVIT filter effective areas (relative) shown. Top panel: filter F169M (Sapphire; λeff: 1608 Å) is shown with a green curve and filter F172M (Silica; λeff: 1717 Å) is shown in magenta. Bottom panel: NUV filter N219M (B15; λeff: 2196 Å) is shown with a green curve while the filter N279N (N2; λeff: 2792 Å) is shown in magenta. The IUE spectra obtained on the central position (Feibelman 2001) is shown in blue and offset positions are shown in red and black. Line identifications are from Feibelman (2001) and Beintema & Pottasch (1999). The flux of the red spectrum has been multiplied by a constant factor of 2.3 to scale it with the nebular spectrum from the centre on the [N IV] line at 1486 Å. |
| In the text | |
|
Fig. 2 UVITimages of NGC 6302. Top panel: NUV image in the filter N279N on the left and the N219M filter on the right. Bottom panel: FUV images of the filter F169M on the left and images in the filter F172M on the right. |
| In the text | |
|
Fig. 3 Top left panel: enhanced UVIT image (smoothed and with a higher contrast to show larger and fainter features) of NGC 6302 in F169M filter showing the fainter extensions. The FUV lobes are inclined at an angle to the east-west direction at PA of 113°. The “jets” are almost perpendicular to the FUV lobes. An optical image has been superposed (in green) on the figure for comparison of the size of FUV lobes and jets with the optical nebula. We note that the optical lobes are extended in east-west direction and the torus in north-south. Bottom panel: profiles of crosscuts (in flux density units – erg cm−2 s−1 Å−1 subpix−2 across the white line shown in top left panel) in the filters F169M and F172M. We note the extent of the lobes in the F169M image (blue) relative to that of the F172M image (red). Although the core of the profiles in both filters are of the same extent and are similar to that of optical nebular images, only F169M image has lobes that extend on either side to about 5 arcmin. Top right panel: star-subtracted 3D plot of the F169 image. An optical image(in red) has been superposed for comparison. The eastern and shorter western lobes can be clearly seen in this plot. |
| In the text | |
|
Fig. 4 Contour plots of the F169M image at various flux levels. The contours in these figures correspond to a flux above background of panel a: 2.2 σ, panel b: 1.9 σ, panel c: 1.7 σ, panel d: 1.5 σ, panel e: 1.2 σ, panel f: 1.0 σ, panel g: 0.7 σ, and panel h: 0.5 σ. Panel c: we note the beginnings of the jet both to the north as well as the south of the nebula. As we move towards the edge of the jets the flux level falls off with the full extent being visible in panels g and h. Panels e and f: we note that the jet is not homogeneous in flux. Panel i: star-subtracted 3D plot in the flux range mentioned above. The small-extensions are to the north and south of the ones seen in panel c and in Fig. 5. Panel j: similar to the plot above but with a larger range in flux. The entire jet can be seen as a ridge similar to what we see in panel g. |
| In the text | |
|
Fig. 5 Enhanced F169M image with contours at 4.2 × 10⁻¹⁹ erg cm−2 s−1 Å−1 arcsec−2 (1.7σ; Fig. 4c) superposed (in green) with a deep [N II] image from Hua et al. (1998, Fig. 18b). We note the similarity inshape of the extensions to the north and south of the nebula in the both F169M and [N II] image, though in the F169M image the features are of a larger size. |
| In the text | |
Current usage metrics show cumulative count of Article Views (full-text article views including HTML views, PDF and ePub downloads, according to the available data) and Abstracts Views on Vision4Press platform.
Data correspond to usage on the plateform after 2015. The current usage metrics is available 48-96 hours after online publication and is updated daily on week days.
Initial download of the metrics may take a while.