Fig. 4
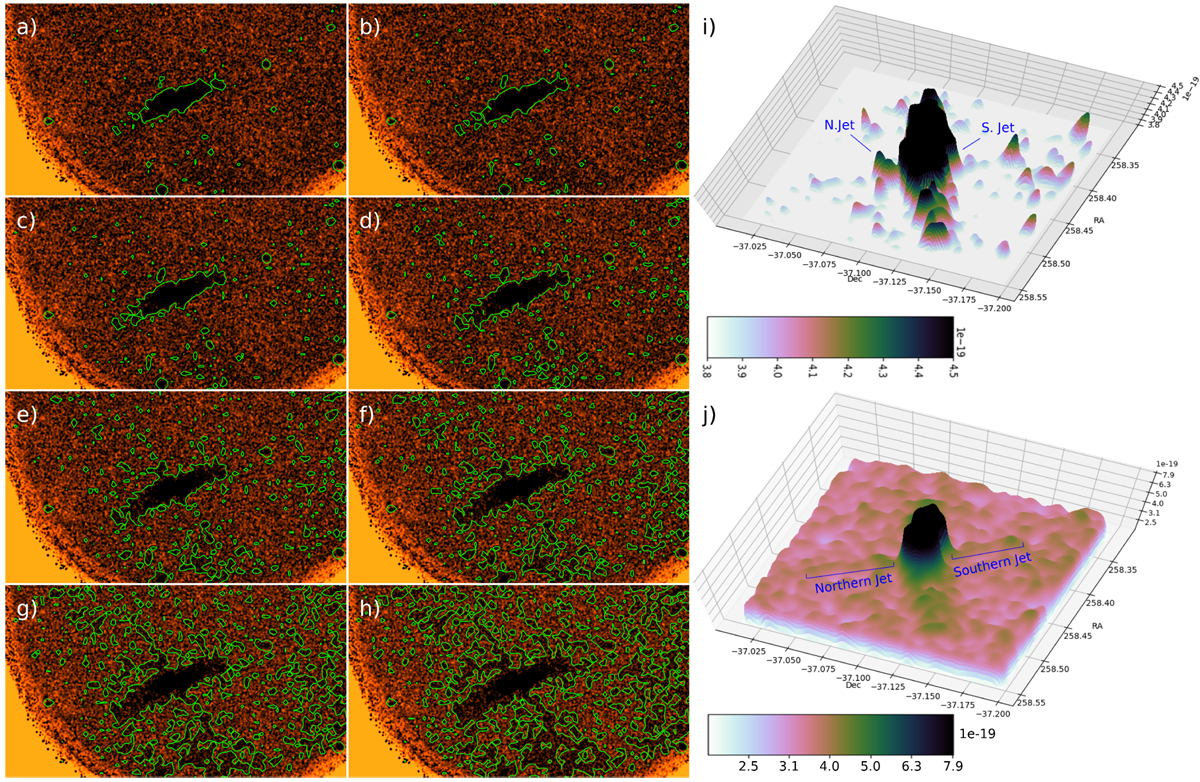
Contour plots of the F169M image at various flux levels. The contours in these figures correspond to a flux above background of panel a: 2.2 σ, panel b: 1.9 σ, panel c: 1.7 σ, panel d: 1.5 σ, panel e: 1.2 σ, panel f: 1.0 σ, panel g: 0.7 σ, and panel h: 0.5 σ. Panel c: we note the beginnings of the jet both to the north as well as the south of the nebula. As we move towards the edge of the jets the flux level falls off with the full extent being visible in panels g and h. Panels e and f: we note that the jet is not homogeneous in flux. Panel i: star-subtracted 3D plot in the flux range mentioned above. The small-extensions are to the north and south of the ones seen in panel c and in Fig. 5. Panel j: similar to the plot above but with a larger range in flux. The entire jet can be seen as a ridge similar to what we see in panel g.
Current usage metrics show cumulative count of Article Views (full-text article views including HTML views, PDF and ePub downloads, according to the available data) and Abstracts Views on Vision4Press platform.
Data correspond to usage on the plateform after 2015. The current usage metrics is available 48-96 hours after online publication and is updated daily on week days.
Initial download of the metrics may take a while.