| Issue |
A&A
Volume 620, December 2018
|
|
|---|---|---|
| Article Number | A76 | |
| Number of page(s) | 12 | |
| Section | Stellar atmospheres | |
| DOI | https://doi.org/10.1051/0004-6361/201833387 | |
| Published online | 03 December 2018 | |
Comprehensive comparison between APOGEE and LAMOST
Radial velocities and atmospheric stellar parameters
1
Department of Astronomy, University of Virginia, Charlottesville, VA 22904-4325, USA
e-mail: ba7t@virginia.edu
2
Department of Physics & Astronomy, Macquarie University, Balaclava Rd, NSW 2109, Australia
3
Instituto de Astrofísica de Canarias (IAC), 38205 La Laguna, Tenerife, Spain
4
Universidad de La Laguna (ULL), Departamento de Astrofísica, 38206 La Laguna, Tenerife, Spain
5
ELTE Eötvös Lorand University, Gothárd Astrophysical Observatory, Szombathely, Hungary
6
Premium Postdoctoral Fellow of the Hungarian Academy of Sciences, Hungary
7
Lund Observatory, Department of Astronomy and Theoretical Physics, Lund University, Box 43, 22100 Lund, Sweden
8
Department of Astrophysical Sciences, Princeton University, 4 Ivy Lane, Princeton, NJ 08544, USA
9
The Observatories of the Carnegie Institution for Science, 813 Santa Barbara Street, Pasadena, CA 91101, USA
10
Center for Astrophysics and Space Astronomy, University of Colorado, 389 UCB, Boulder, CO 80309-0389, USA
11
University of Arizona, Tucson, AZ 85719, USA
12
Observatório Nacional, São Cristóvõ, Rio de Janeiro, Brazil
13
National Optical Astronomy Observatories, Tucson, AZ 85719, USA
Received:
7
May
2018
Accepted:
18
July
2018
Context. In the era of massive spectroscopy surveys, automated stellar parameter pipelines and their validation are extremely important for an efficient scientific exploitation of the spectra.
Aims. We undertake a critical and comprehensive comparison of the radial velocities and the main stellar atmosphere parameters for stars in common between the latest data releases from the Apache Point Observatory Galaxy Evolution Experiment (APOGEE) and the Large sky Area Multi-Object Spectroscopic Telescope (LAMOST) surveys.
Methods. APOGEE is a high-resolution (R = 22 500) spectroscopic survey with high signal-to-noise ratio that is part of the Sloan Digital Sky Survey (SDSS). The latest data release, SDSS DR14, comprises APOGEE spectra for 263 444 stars, together with main stellar parameters and individual abundances for up to 20 chemical species. LAMOST is a low-resolution (R = 1800) optical spectroscopic survey also in the Northern Hemisphere, where 4000 fibers can be allocated simultaneously. LAMOST DR3 contains 3 177 995 stars.
Results. A total of 42 420 dwarfs and giants stars are in common between the APOGEE DR14 – LAMOST DR3 stellar catalogs. A comparison between APOGEE and LAMOST RVs shows a clear offset of 4.54 ± 0.03 km s−1, with a dispersion of 5.8 km s−1, in the sense that APOGEE radial velocities are higher. We observe a small offset in the effective temperatures of about 13 K, with a scatter of 155 K. A small offset in [Fe/H] of about 0.06 dex together with a scatter of 0.13 dex is also observed. We note that the largest offset between the surveys occurs in the surface gravities. Using only surface gravities in calibrated red giants from APOGEE DR14, with which there are 24 074 stars in common, a deviation of 0.14 dex is found with substantial scatter (0.25 dex). There are 17 482 red giant stars in common between APOGEE DR14 and those in LAMOST tied to APOGEE DR12 via the code called the Cannon. There is generally good agreement between the two data-sets. However, we find that the differences in the stellar parameters depend on effective temperature. For metal-rich stars, a different trend for the [Fe/H] discrepancies is found. Surprisingly, we see no correlation between the internal APOGEE DR14 – DR12 differences in Teff and those in DR14 – LAMOST tied to DR12, where a correlation should be expected since LAMOST has been calibrated to APOGEE DR12. We find no correlation either between the [Fe/H] discrepancies, suggesting that LAMOST/Cannon is not well coupled to the APOGEE DR12 stellar parameter scale. An [Fe/H] dependence between the stellar parameters in APOGEE DR12 and those in DR14 is reported. We find a weak correlation in the differences between APOGEE DR14 – DR12 and LAMOST on DR12 surface gravity for stars hotter than 4800 K and in the log g range between 2.0 and 2.8 dex. We do not observe an [Fe/H] dependency in the gravity discrepancies.
Key words: surveys / stars: fundamental parameters / asteroseismology
© ESO 2018
1. Introduction
The structure of a stellar atmosphere is principally determined by three atmospheric parameters: the effective temperature, the surface gravity, and the chemical enrichment level. These parameters are the foundation of the physical interpretation of stellar spectra, and are together with radial velocities the most important measurements sought after for the different scientific goals of current massive stellar spectroscopic surveys. Hence automated stellar parameter pipelines (SPPs) and their validation are extremely important for the scientific exploitation of these survey data (Lee et al. 2008; Smolinski et al. 2011, and Anguiano et al. 2015).
In this study we focus on the latest data releases from two large ongoing observational programs, the APOGEE (Majewski et al. 2017) and LAMOST (Zhao et al. 2012) surveys. Our main goal is to work out a comprehensive comparison between the radial velocities and the main stellar atmosphere parameters for the stars in common between the two surveys. This comparison can illuminate how similar the stellar velocity and atmospheric parameters are for each survey, to evaluate random errors, and to find systematic effects within the data sets. This comparison is especially helpful because LAMOST observes in the optical at medium-low resolution, while the APOGEE survey works in the H band at higher resolving power, and they use different analysis methods to obtain the information from the observed spectra.
Data-driven methods for measuring stellar parameters, like the code called the Cannon (Ness et al. 2015), have been developed in recent years to bring surveys with disjoint wavelength coverage and different resolving power onto the same scale using a training sample observed by both spectroscopic programs. Recently, Ho et al. (2017) used the Cannon to transfer information from APOGEE data release 12 (DR12) to determine precise stellar parameters from the spectra of 450 000 LAMOST giants. In this study we also use the intersection between the APOGEE and LAMOST data sets to compare the more recent data release 14 (DR14) of APOGEE to the LAMOST giants calibrated to the APOGEE DR12 scale. Moreover, asteroseismology in the Kepler field (Borucki et al. 2010) provides accurate surface gravities for red giants. Using the overlap between APOGEE and LAMOST, and also the photometric survey SAGA (Casagrande et al. 2014) in the Kepler field, we are able to quantify the discrepancies between surface gravity derived from spectroscopic analysis and those from asteroseismology (Pinsonneault et al. 2014).
This paper is organized as follows. In Sect. 2 we describe the APOGEE and LAMOST surveys together with the stellar catalog of common stars. Sky coverage, magnitude range, signal-to-noise ratio (S/N), radial velocities, and stellar parameters together with their uncertainties and systematic effects are discussed in detail. The APOGEE and LAMOST targets in the Kepler field are described in Sect. 3. We emphasize that in Sects. 2 and 3 we compare the pipelines specific to APOGEE and LAMOST. In Sect. 4 we study the discrepancies between APOGEE and LAMOST calibrated to the APOGEE DR12 stellar parameters scale via the Cannon. We present our conclusions and describe the opportunity that this massive overlap between the surveys presents for building a robust training data-set for data-driven methods for measuring stellar parameters in Sect. 5.
2. APOGEE-LAMOST stellar catalog
The Apache Point Observatory Galaxy Evolution Experiment (APOGEE), and its successor APOGEE-2, is a high-resolution (R ∼ 22 500), high-S/N (S/N > 100 per half resolution element) spectroscopic survey using the 2.5-m Sloan telescope in the Northern Hemisphere and the du Pont telescope at Las Campanas Observatory for the Southern Hemisphere (Majewski et al. 2017). The survey operates in the near-infrared H band, and can take 300 spectra simultaneously (Wilson et al. 2010). The latest APOGEE data release, DR14 (Abolfathi et al. 2018), comprises spectra for 263 444 stars, together with main stellar parameters and individual abundances for up to 15 chemical species.
The Large sky Area Multi-Object Spectroscopic Telescope (LAMOST) is a national scientific research facility operated by the Chinese Academy of Sciences. LAMOST is a low-resolution (R ∼ 1800), optical (3650–9000 Å) spectroscopic survey in the Northern Hemisphere. Using a modified Schmidt telescope, LAMOST can observe up to 4000 objects simultaneously over a 20 square degrees field of view. The LAMOST Experiment for Galactic Understanding and Exploration (LEGUE) is an ongoing Galactic survey with a current sample of more than five million stellar spectra (Deng et al. 2012). LAMOST DR31 published 3 177 995 stars in this catalog, including 45 826 A-type stars, 988 947 F-type stars, 1 600 512 G-type stars, and 542 710 K-type stars. These objects are selected with the criteria of having an S/N in the g band higher than 6 obtained during dark nights, and an S/N in g band higher than 15 obtained during bright nights.
Using a comparison of positions in equatorial coordinates between the surveys, we selected stars where (Δα2 + Δδ2)1/2 < 3 arcsec, and find a total of 42 420 stars in common between APOGEE DR14 and LAMOST DR3. For this study we used the APOGEE flag called ASPCAPFLAG, to remove stars where any of the TEFF, LOGG, CHI2, COLORTE, ROTATION, and S/N flags are set (see Holtzman et al. 2015; García Pérez et al. 2016; for full details on the different flags used in APOGEE data). This leaves 41 547 objects in the APOGEE – LAMOST stellar catalog.
2.1. Sky coverage and magnitude range
In Fig. 1 we show the Galactic coordinates of the APOGEE-LAMOST stellar catalog in a Hammer–Aitoff projection. Because of the Northern Hemisphere location of LAMOST and the SDSS-telescope APOGEE used for DR12 and DR14, most of the common stars lie in the Galactic anticenter and in the North Galactic Cap.
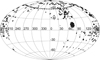 |
Fig. 1. Hammer–Aitoff projection in Galactic coordinates (l, b) of the APOGEE-LAMOST stellar catalog distribution. Most of the stars are in the North Galactic Pole and in the Galactic anticenter. Note also the Kepler field around l ∼ 70°, b ∼ +15°. |
There are also common targets in the Kepler field, where the spectroscopic parameters provided by the APOGEE project are complemented with asteroseismic surface gravities, masses, radii, and mean densities determined by members of the Kepler Asteroseismology Science Consortium (KASC; Pinsonneault et al. 2014). There are similar efforts within the LAMOST collaboration in the Kepler fields (Ren et al. 2016).
Figure 2 shows the H-band luminosity distribution for the APOGEE – LAMOST stellar catalog compiled in this study. Most stars in common between APOGEE and LAMOST are in the magnitude range from 9 to 12 in the H band.
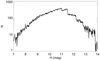 |
Fig. 2. Luminosity distribution function in the H band for the APOGEE – LAMOST stellar catalog. The catalog covers a broad magnitude range from 7 to almost 14 mag. Most of the stars are in the magnitude range from 9 to 12 in the H band. |
2.2. Signal-to-noise ratio
APOGEE aims to obtain high-resolution H-band spectra with high S/N (<100 per half-resolution element of pixels) for stars in the bulge, disk, and halo of the Milky Way (Zasowski et al. 2013, 2017). Most APOGEE targets are observed in several visits. After multiple visits, a combined spectrum is produced (Nidever et al. 2015). LAMOST DR3 provides the S/N per pixel for the targets as calculated in five different bands, u, g, r, i and z. Using the center wavelength and bandwidth, they obtain the wavelength range for each SDSS band, and then the S/N in each band is the median value at each pixel in this band (Luo et al. 2015). The cumulative histograms of S/N in APOGEE and in LAMOST for the z band (left panel in Fig. 3) shows that the APOGEE survey has 80% of stars in common with S/N > 100, and 40% with S/N > 200. The LAMOST survey has 40% of stars in common with S/N > 100, and 10% with S/N > 2002. The right panel in Fig. 3 shows the S/N from APOGEE and LAMOST spectra for the common stellar catalog as a function of the H-band magnitude from the 2MASS survey (Skrutskie et al. 2006). This figure shows a clear relation between magnitude and S/N in APOGEE. This relation is weaker in LAMOST DR3 data and the H band, where a given stellar magnitude has a wide range in S/N.
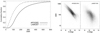 |
Fig. 3. Left panel: cumulative histograms of S/N per half-resolution element (approximately a pixel) for APOGEE (solid line) and S/N per pixel for LAMOST (dashed line), as provided from the original catalogs. Right panels: S/N from APOGEE and LAMOST spectra for the common objects as a function of the H-band magnitude from the 2MASS survey. |
2.3. Radial velocities
In APOGEE DR14 (Abolfathi et al. 2018), RVs are determined for each individual visit to identify stars with companion-induced Doppler shifts. The individual visit spectra are resampled and combined to generate a single spectrum for each object. Final RVs are obtained by cross-correlation against a grid of synthetic spectra spanning a wide range of stellar parameters. The APOGEE instrument and the existing RV software routinely deliver RVs per visit at a precision of ∼0.07 km s−1 for S/N > 20, while the survey provides external calibration sufficient to ensure accuracies at the level of ∼0.35 km s−1. RVs in APOGEE are reported with respect to the center of mass (barycenter) of the solar system (Nidever et al. 2015).
The LAMOST 1D pipeline (Luo et al. 2015) also measures the RVs using a cross-correlation method. The pipeline recognizes the stellar spectral classes and simultaneously determines the RVs from the best-fit correlation function between the observed spectra and the template. The RVs are translated from geocentric into barycentric coordinates. Figure 4 shows the mean reported RV uncertainties with respect to the mean S/N for the common catalog between APOGEE and LAMOST. Figure 4 shows the standard deviation of the S/N and the error deviation of σRV for bins of 3000 stars by S/N. Nearly all the stars in the APOGEE catalog in common with LAMOST have σRV < 0.1 km s−1. For stars with S/NAPOGEE > 100, APOGEE determines σRV < 0.03 km s−1. The LAMOST-calculated RV uncertainties for stars in common with APOGEE range from 3.5 to 18 km s−1, depending on the S/N. Stars with S/NLAMOST > 100 show σRV < 8 km s−1 (see Fig. 4).
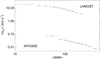 |
Fig. 4. Mean radial velocity uncertainties as a function of the mean S/N for the common stars in APOGEE DR14 and LAMOST DR3. Each point contains 3000 stars. The error bars represent the standard deviation in S/N and the standard error in σRV. |
In Fig. 5 we show the histogram of discrepancies between APOGEE and LAMOST RVs. The discrepancies show a clear offset of 4.54 ± 0.03 km s−1, with a dispersion of 5.8 km s−1. Most of the scatter in the discrepancies is expected to come from LAMOST RV uncertainties (Fig. 4), which suggests that the average LAMOST measurement error for the RVs is ∼6 km s−1. This is consistent with the median in the reported RV LAMOST uncertainty, where the value is ∼6.5 km s−1. Huang et al. (2015) compared 499 RVs from LAMOST DR1 with RVs of the same targets derived from MMT+Hectospec, and also found an offset, in their case of 3.8 ± 0.3 km s−1. Furthermore, a similar offset appears between an external comparison between LAMOST DR1 and SEGUE DR9 for common objects, where the result is 〈ΔRV〉 = 7.2 km s−1. A similar offset is also reported in Schönrich & Aumer (2017) for the LAMOST survey.
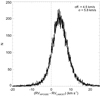 |
Fig. 5. Histograms of discrepancies between APOGEE and LAMOST RVs. The distribution shows a mean offset of about 5 km s−1. |
In Fig. 6 we explore the mean RV discrepancies as a function of 〈S/N〉, 〈Teff〉, 〈[Fe/H]〉 and 〈log g〉 from APOGEE DR14. We find no clear systematic trends between the RV discrepancies and the stellar parameters, except for a weak trend of amplitude 1 km s−1 as a function of 〈[Fe/H]〉 (lower left panel in Fig. 6). Based on the lack of trends in what we are able to compare between the data sets, the origin of the global RV offset between the surveys is unclear.
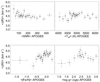 |
Fig. 6. Mean radial velocity discrepancies with respect to 〈S/N〉, 〈Teff〉, 〈[Fe/H]〉, and 〈log g〉 from APOGEE DR14. No clear systematic trends between the RVs discrepancies and stellar parameters are visible where the amplitude is ≤1 km s−1. |
2.4. Stellar atmospheric parameters
Stellar parameters are derived from the combined APOGEE spectra with the APOGEE stellar parameters and chemical abundances Pipeline (ASPCAP; García Pérez et al. 2016), where an interpolated grid of synthetic spectra (e.g., Zamora et al. 2015) is searched to find the best match to each observed spectrum. ASPCAP performs a a multidimensional χ2 minimization using the code FERRE3. We emphasize that for this comparison we used APOGEE calibrated stellar parameters. ASPCAP derives parameters for nearly all the observed stars, but these parameters show systematic errors, most likely associated with shortcomings in the models. Hence, APOGEE produces calibrated parameters, that is, surface gravities calibrated to seismic gravities via asteroseismology for giant stars. We refer to Holtzman et al. (2015) and García Pérez et al. (2016), where ASPCAP and calibrated parameters are explained in detail.
The LAMOST stellar parameter pipeline (LASP) also automatically determines the fundamental stellar parameters from LAMOST spectra. LASP adopts two methods to obtain a single set of derived stellar parameters: (i) the correlation function initial (CFI) values (Du et al. 2012) followed by the ULySS package (Wu et al. 2011), and (ii) the CFI method is used to make an initial guess for the stellar parameters, while ULySS generates the final values from the observed spectra (Luo et al. 2015).
In Fig. 7 we show the stellar atmospheric parameters for temperature, metallicity, and surface gravity reported in APOGEE DR14 (black line) and in LAMOST DR3 (red line) for the APOGEE – LAMOST catalog. The histograms show the stellar parameter range we compare in this exercise. Figure 8 shows the histograms of discrepancies between derived Teff, [Fe/H], and log g in logarithmic scale from the APOGEE and LAMOST surveys for the objects in common. We observe a small offset in effective temperature of about 13 K, with a scatter of 155 K. We also observe a small offset in [Fe/H] of about 0.06 dex together with a scatter of 0.13 dex. Using only surface gravities in calibrated red giants from APOGEE DR14, where there are 24 074 stars in common, we note that the largest offset between the two surveys occurs in the surface gravities, where a deviation of 0.14 dex is observed with a substantial scatter of 0.25 dex. Holtzman et al. (in prep.) reported that at low surface gravities, the APOGEE ASPCAP spectroscopy surface gravities are systematically higher than the asteroseismic surface gravities; as a result, the log g in APOGEE DR14 is calibrated using a linear surface gravity fit to the seismic log g measured for giants in the first APOKASC catalog (Pinsonneault et al. 2014). This calibration could explain the offset reported here with respect to the LAMOST surface gravities. More details about the spectroscopic and photometric NASA Kepler field follow-ups is given in Sect. 3. Figure 8 also shows that the histograms of discrepancies between the measured stellar parameters in APOGEE and LAMOST are not symmetric, which suggests that other systematic effects may be present in the data.
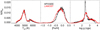 |
Fig. 7. Temperature, metallicity, and surface gravity distribution of the APOGEE-LAMOST catalog, using the stellar parameters from APOGEE DR14 (black line), and the parameters reported in LAMOST DR3 (red line). |
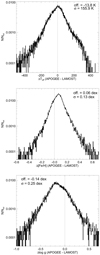 |
Fig. 8. Histograms of discrepancies between effective temperature (upper panel), metallicity (middle panel), and surface gravity (bottom panel) in logarithmic scale. The offset between APOGEE and LAMOST for the surface gravity is clear, as is a substantial scatter of 0.25 dex. See text for details. |
Figure 9 shows the Teff – log g diagram from the APOGEE DR14 and LAMOST DR3 stellar parameters, color-coded by [Fe/H]. Overplotted are 5 Gyr isochrones (Bressan et al. 2012) at three different metallicities, as indicated in the figure. The theoretical stellar tracks and the data sets from the two surveys agree well in general. However, the Red Clump (RC) appears clearly distinct in the APOGEE Teff – log g diagram around log g ∼ 2.5, while the clump in the LAMOST data is more diffuse, showing a spread from 2.2 to 2.7 dex in surface gravity. In the next sections we explore the reported uncertainties associated with the atmosphere stellar parameters.
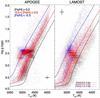 |
Fig. 9. Teff – log g diagram from APOGEE DR14 (left panel) and LAMOST DR3 (right panel) stellar atmosphere parameters for the stars in common, color-coded by three different ranges in [Fe/H]. Overplotted are 5 Gyr isochrones (Bressan et al. 2012) at [Fe/H] = +0.3, –0.2, and –1.0 dex. The error bars represent the typical uncertainties in Teff and log g in the two surveys. |
2.4.1. Uncertainties
In Fig. 10 we explore the quoted uncertainties in the main atmosphere stellar parameters in the APOGEE-LAMOST stellar catalog. The three panels show the reported uncertainties in Teff, [Fe/H], and log g as a function of the S/N for both surveys.
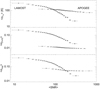 |
Fig. 10. Average uncertainty in Teff, [Fe/H], and log g as a function of the average APOGEE 〈S/N〉 for stars in common in the APOGEE and LAMOST survey. Every point has 1500 stars, and the error bars represent the standard deviation in the S/N bin and the standard error of the mean for Teff, [Fe/H], and log g. |
From the entire sample in common, we calculated the mode of the reported uncertainty distribution for the three atmospheric parameters. The median APOGEE uncertainties are ∼90 K, ∼0.01 dex, and ∼0.06 dex in Teff, [Fe/H], and log g, respectively. For LAMOST, we find ∼80 K, ∼0.08 dex, and also ∼0.12 dex, respectively. Based on these latter values, the reported LAMOST DR3 uncertainties seem underestimated. Interestingly, the uncertainties in the APOGEE DR14 stellar parameters are nearly independent of the S/N, the curve describing an asymptote that reaches a floor due to systematics. On the other hand, the uncertainties reported in the LAMOST DR3 show a clear dependence on the S/N, with no clear floor reached at the highest S/N. For the effective temperature, stars with S/NLAMOST > 100 show that on average, σTefflamost < σTeffapogee. For iron abundances, APOGEE uncertainties are on average lower than the iron uncertainties reported in LAMOST, independent of the S/N of the spectrum, while stars with S/NLAMOST > 150 report on average more precise surface gravity uncertainties than those claimed for the APOGEE sample (Fig. 10). We use the histograms of discrepancies between stellar parameter to understand the true error values behind the data, where we assume that the observed scatter constrains the stellar parameter uncertainties. In Table 1 we show the mean offset determined from the histograms of discrepancies, the observed scatter, and the sum of the uncertainties in the two catalogs. Although the discrepancies are not perfect Gaussians as a result of the systematic effects in the data (see Fig. 8), we assume that  . Table 1 shows that for stars with S/NLAMOST > 200, the intrinsic scatter from the discrepancies is always larger than
  . Moreover, we saw in Fig. 10 that APOGEE stellar parameters are nearly independent of S/N. We therefore conclude that at high S/N (>100), the uncertainties from LAMOST are underestimated.
Offset from the histogram of discrepancies, observed scatter, and sum of uncertainties in the two catalogs for different S/N ranges in the LAMOST survey.
2.4.2. Systematic effects
We used the APOGEE-LAMOST stellar catalog to explore systematic errors in the atmosphere stellar parameters derived using the respective survey stellar pipelines described above. In Fig. 11 we show the discrepancies in Teff between the surveys for stars in common as a function of 〈S/N〉, 〈Teff〉, 〈[Fe/H]〉, and 〈log g〉, where every point bins 1500 stars. ΔTeff has small variations with respect to the APOGEE S/N, with an amplitude smaller than 80 K. Interestingly, we observe that ΔTeff changes sign for stars colder than ∼4500 K and for stars hotter than ∼5200 K. The offset for the cold stars is around ∼50 K, but for hot stars, it reaches values of 100 K (see the top panels in Fig. 11). The trend between ΔTeff and 〈[Fe/H]〉 is clear, where the sign of ΔTeff changes at solar metallicity. No trend is evident between 〈log g〉 and ΔTeff (see lower panels in Fig. 11).
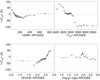 |
Fig. 11. Mean effective temperature discrepancies (APOGEE – LAMOST) as a function of 〈S/N〉, 〈Teff〉, 〈[Fe/H]〉, and 〈log g〉. |
Figure 12 shows the change in average discrepancy in [Fe/H] with respect to the 〈S/N〉 and the main stellar parameters. The offset of ∼0.06 dex is evident, as reported above. This offset is nearly independent of the 〈S/N〉 in the APOGEE spectra, although for stars with S/N < 100, the offset extends from 0.06 to 0.1 dex (see the top left panel in Fig. 12). We also find a clear relation between 〈Teff〉 and Δ[Fe/H]. The metallicity offset is larger for colder stars, while for stars with Teff > 5200 K, Δ[Fe/H] ∼ 0.0 dex (top right panel in Fig. 12). Δ[Fe/H] is independent of the 〈[Fe/H]〉 for the range –0.5 < [Fe/H] < 0.5 dex, but there is a relation between the two quantities for stars more metal poor than –0.5 dex. Interestingly, for stars in the surface gravity range 1.0 < log g < 1.5, we do not see the offset in [Fe/H] (lower panels in Fig. 12).
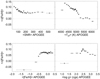 |
Fig. 12. Mean [Fe/H] discrepancies (APOGEE – LAMOST) as a function of 〈S/N〉, 〈Teff〉, 〈[Fe/H]〉, and 〈log g〉. |
Finally, Fig. 13 shows Δlog g as a function of the main stellar parameters from APOGEE and the average S/N. As in the previous figures, each point represents 1500 stars and the errors bars are the standard error of the mean for log g and the standard deviation in the S/N. As described above, there is an offset of ∼0.15 dex in Δlog g. This offset is independent of the S/N of the observed spectra. For stars colder than 4800 K, we observe a dependence between Δlog g and Teff. In the lower panels of Fig. 13, Δlog g as a function of 〈[Fe/H]〉 shows variations of about 0.1 dex. We also find a dependence between 〈log g〉 and Δlog g for stars with log g < 2.5 dex.
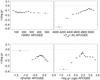 |
Fig. 13. Mean surface gravity discrepancies (APOGEE – LAMOST) with respect to 〈S/N〉, 〈Teff〉, 〈[Fe/H]〉, and 〈log g〉. |
3. NASA Kepler field
In Sect. 2.4 we reported a substantial offset in the surface gravity of 0.14 dex between the two surveys. We can make use of the NASA Kepler mission (Borucki et al. 2010) to independently check the source of the discrepancies. The Kepler mission has obtained high-precision photometric data over the past four years. Kepler data enable precise stellar astrophysics thanks to asteroseismic measures of red giants, where uncertainties in surface gravity <0.05 dex can be derived (Mathur et al. 2017 and references therein). The APOGEE-LAMOST stellar catalog contains 6846 stars in the Kepler field.
The Strömgren Survey for Asteroseismology and Galactic Archaeology (SAGA) also mapped the Kepler field using the uvby Strömgren photometric system. Effective temperatures in the SAGA survey are derived using the infrared flux method (IRFM). This technique uses multiband optical and infrared photometry to recover the bolometric and infrared flux of each star, from which its Teff and angular diameter can be computed (Casagrande et al. 2014). The APOGEE survey contains 588 stars in common with SAGA, while LAMOST contains 312 objects. Figure 14 shows the histogram of discrepancies between APOGEE and SAGA for Teff, [Fe/H], and log g in black lines, and between LAMOST and SAGA (red lines). We find a small offset of −43 K in Teff between APOGEE and SAGA and also between LAMOST and SAGA. This similarity between APOGEE and LAMOST Teff is consistent with our earlier assessment finding in Fig. 8.
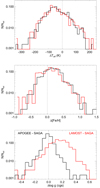 |
Fig. 14. Histograms of discrepancies for the main stellar atmosphere parameters between the surveys APOGEE – SAGA (black lines) and LAMOST – SAGA (red lines). See text for more details. |
There is also a consistent offset in [Fe/H] of +0.16 dex between APOGEE and SAGA and LAMOST and SAGA, together with a substantial scatter of 0.3 dex. For the surface gravities we find a good agreement with a scatter of 0.09 dex between APOGEE and SAGA. The discrepancies between LAMOST and SAGA show a clear offset in gravities of 0.14 dex, where the comparison is dominated by red giants. In Sect. 2.4 we described how APOGEE surface gravities from spectroscopy are calibrated to seismic gravities, while the SAGA survey also uses global oscillation parameters to obtain log g. We summarize our findings in Table 2.
Average discrepancies and standard deviationsin the main stellar parameters for stars in common between APOGEE – SAGA (588 stars) and LAMOST – SAGA (312 stars) in the Kepler field.
Recently, Mathur et al. (2017) revised stellar properties for a total number of 197 096 Kepler targets, where the priority list for input surface gravity comes from asteroseismology. We have 17 131 stars in common between APOGEE and Mathur et al. (2017). With LAMOST, there are 32 547 objects in common with Mathur et al. We represent in Fig. 15 the histogram of discrepancies for the surface gravity between APOGEE giants and LAMOST giants and dwarfs with respect to the gravities calibrated in the latter study. Additionally, in the LAMOST comparison, we divided the sample into giants and dwarfs using a simple selection in log g, where stars with log g < 3.5 are considered to be giants. We find good agreement between log g in APOGEE and the surface gravities revised in Mathur et al. Interestingly, the surface gravity for dwarfs stars in LAMOST show an agreement with the gravities derived in Mathur et al. for the Kepler field, but for giants, there is a clear offset and a large scatter of 0.24 dex. Calibrating LAMOST to Kepler could resolve this discrepancy. See Table 3 for the simple statistics describing this comparison.
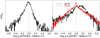 |
Fig. 15. Discrepancies between the surface gravity derived in APOGEE, LAMOST and Mathur et al. (2017). See text for details. |
Surface gravity average discrepancies and its standard deviation with respect APOGEE (Mathur et al. 2017), and LAMOST (Mathur et al. 2017) in the NASA Kepler field.
4. The Cannon on LAMOST
Ho et al. (2017) used a data-driven approach to spectral modeling, the Cannon (Ness et al. 2015), to transfer the calibrating information from the APOGEE survey to determine precise Teff, log g, and [Fe/H] from the spectra of 454 180 LAMOST DR2 giants. Ho et al. (2017) selected 9952 objects common to LAMOST DR2 and APOGEE DR12 for their training set, and these objects span a representative range of parameter space for giants (see their Fig. 4 for details), but are relatively concentrated compared to the parameter ranges explored in this paper so far. We find 17 482 stars in common between APOGEE DR14 and the catalog from Ho et al. (2017). Figure 16 shows the histogram of discrepancies between APOGEE DR14 and LAMOST/Cannon for Teff, [Fe/H] and log g, respectively. The two data-sets agree well in general. The offset in [Fe/H] we found in Fig. 8 by comparing APOGEE DR14 and LAMOST DR3 is less evident in this new comparison, but the scatter remains similar. Moreover, the offset in log g is still present, with a scatter of ∼0.2 dex.
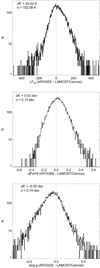 |
Fig. 16. Histograms of discrepancies for the main stellar atmosphere parameters between the APOGEE DR14 and LAMOST tied to APOGEE DR12 via the Cannon. See text for more details. |
We also studied the behavior of the discrepancies in the atmosphere parameters with respect to S/N, Teff, [Fe/H], and log g. Figure 17 shows that the discrepancies in the stellar parameters are nearly independent of the S/N of the APOGEE spectra. However, we find some dependence in the discrepancies of the stellar parameters with respect to Teff, particularly at the coolest Teff. For metal-rich stars, we also find a different trend for the [Fe/H] discrepancies with respect to [Fe/H] in APOGEE DR14.
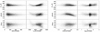 |
Fig. 17. Main stellar parameters discrepancies between APOGEE DR14 and LAMOST, tied to APOGEE DR12 via the Cannon, as a function of 〈S/N〉, 〈Teff〉, 〈[Fe/H]〉, and 〈log g〉 for stars in common. |
A helpful exercise for understanding how the different calibrations and data analysis pipelines are performing is to compare the stellar parameters from APOGEE DR12 to APOGEE DR14 versus LAMOST tied to APOGEE DR12 using the Cannon. Figure 18 shows the discrepancies in Teff between APOGEE DR14 – APOGEE DR12 versus APOGEE DR14 – LAMOST, where the latter has been calibrated using stellar parameters from APOGEE DR12 as a reference. The figures are color-coded with respect to Teff (top panels), [Fe/H] (middle panels), and log g (bottom panels) from APOGEE DR14. The trends in Fig. 18 show that there is a temperature and metallicity dependence in the calibration from DR12 to DR14 (Holtzman et al., in prep.). These dependences are also present in the transformation of LAMOST into APOGEE DR12 parameters space via the Cannon. These temperature and metallicity dependences are weaker than those observed in the transformation from DR12 into DR14. Interestingly, there is no correlation between the DR14 – DR12 discrepancies and DR14 – LAMOST tied to DR12 for Teff, where a correlation would be anticipated if the parameters derived from LAMOST spectra were brought onto the APOGEE DR12 scale. More specifically, if the LAMOST parameters and abundances were perfectly tied to the APOGEE DR12 scale, we would expect to see the known differences between DR12 and DR14 imprinted on the LAMOST parameters.
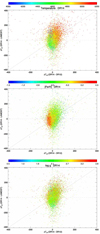 |
Fig. 18. Teff discrepancies between APOGEE DR14 and DR12 with respect to APOGEE DR14 and LAMOST on the APOGEE DR12 stellar parameters space. The three graphics are color-coded by Teff, [Fe/H] and log g from APOGEE DR14. |
Figure 19 shows the [Fe/H] discrepancies from APOGEE DR14 – DR12 and DR14 – LAMOST calibrated by DR12 via the Cannon. We find no correlation between the [Fe/H] discrepancies here either, suggesting that LAMOST/Cannon is not entirely in the APOGEE DR12 abundances space. The graphics color-coded by Teff, [Fe/H], and log g from DR14 also indicate that there is an [Fe/H] dependence in the calibration from APOGEE DR12 to DR14.
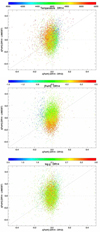 |
Fig. 19. [Fe/H] discrepancies between APOGEE DR14 and DR12 with respect to APOGEE DR14 and LAMOST on the APOGEE DR12 stellar parameters space. The three graphics are color-coded by Teff, [Fe/H], and log g from APOGEE DR14. |
Finally, Fig. 20 shows the surface gravity discrepancies. Unlike the previous comparison, we do see a weak correlation that would suggest the mapping of LAMOST parameters to APOGEE DR12. The correlation has a broad scatter, and there is a stellar temperature dependency (top panel in Fig. 20). We do not observe an [Fe/H] dependence in the gravity discrepancies.
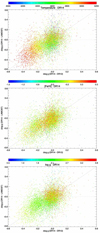 |
Fig. 20. Surface gravity discrepancies between APOGEE DR14 and DR12 with respect to APOGEE DR14 and LAMOST on the APOGEE DR12 stellar parameters space. The three graphics are color-coded by Teff, [Fe/H], and log g from APOGEE DR14. |
5. Conclusions
In this section we summarize our findings from this exercise.
We created the APOGEE-LAMOST stellar catalog by combining APOGEE DR14 and LAMOST DR3, and find a total of 42 420 stars in common. Most of the common stars lie in the Galactic anticenter and in the North Galactic Cap. There are also common objects in the Kepler field. The luminosity distribution in the H band covers a broad magnitude range, from 7 to nearly 14 mag. Most of the stars lie in the magnitude range from 9 to 12 mag. We find that the APOGEE survey has 80% of these stars with S/N > 100, and 40% with S/N > 200, while the LAMOST survey has 40% of stars with S/N > 100, and 10% with S/N > 200 in the z band.
The histogram of discrepancies between APOGEE and LAMOST RVs shows a clear offset of 4.54 ± 0.03 km s−1, with a scatter of 5.8 km s−1. We observe that most of the scatter in the discrepancies comes from LAMOST RV uncertainties, suggesting that the average LAMOST measurement error for the RVs is ∼6 km s−1. The median reported LAMOST RV uncertainty in APOGEE-LAMOST stellar catalog is 6.5 km s−1; this agrees well with our findings in this comparison study. This seems to be a universal offset because no clear systematic trends are found between the RV discrepancies and the stellar parameters, except for a weak trend of amplitude 1 km s−1 as a function of 〈[Fe/H]〉.
We also investigated histograms of discrepancies for Teff, [Fe/H] and log g between the APOGEE and LAMOST surveys for the stars in common. We recall that we used calibrated APOGEE stellar parameters, while the LAMOST parameters are not calibrated; see Sect. 2.4 for details. We observe a small offset in the effective temperature of about 13 K, with a scatter of 155 K. A small offset in [Fe/H] of about 0.06 dex together with a scatter of 0.13 dex is also found. We note that the largest offset between the two surveys occurs in the surface gravities, where a deviation of 0.14 dex is observed with a substantial scatter of 0.25 dex. The histograms of discrepancies between the measured stellar parameters in APOGEE and LAMOST are not symmetric, suggesting that other systematic effects may be present in the data. For a detailed study on the reported uncertainties, we refer to Sect. 2.4.1.
We used the APOGEE-LAMOST stellar catalog to explore the existence of systematic errors in the atmosphere stellar parameters. ΔTeff has small variations with respect to the APOGEE S/N, where the amplitude is smaller than 80 K. We observe that ΔTeff changes sign for stars colder than ∼4500 K and for stars hotter than ∼5200 K, where the population is dominated by dwarfs. A trend between ΔTeff and 〈[Fe/H]〉 is found; the sign of ΔTeff changes sign at solar metallicity. There are no evident trends between 〈log g〉 and ΔTeff. The average discrepancy in [Fe/H] varies with respect to the 〈S/N〉 and the main stellar atmosphere parameters. For example, we find a relation between 〈[Fe/H]〉 and Δ[Fe/H]. Moreover, the metallicity offset is larger for colder stars, while for stars with Teff > 5200 K, Δ[Fe/H] ∼ 0.0 dex. Δ[Fe/H] is independent of the 〈[Fe/H]〉 for the range –0.5 〈 [Fe/H] 〉 0.5 dex, but there is a relation between the two quantities for stars more metal poor than –0.5 dex. Interestingly, for stars in the surface gravity range 1.0 < log g < 1.5, we do not see the offset in [Fe/H]. As described previously, there is an offset of ∼0.15 dex in Δlog g. This offset is independent of the S/N of the observed spectra. For stars colder than 4800 K, a dependence between Δlog g and Teff is observed. The parameter Δlog g as a function of 〈[Fe/H]〉 shows variations of about 0.1 dex. We also find a dependence between Δlog g and 〈log g〉 for stars with log g < 2.5 dex. The reported systematic trends in Teff are within the uncertainties, while the reported trends for cold, metal-poor giants are significant.
Mathur et al. (2017) revised stellar properties for a total of 197 096 Kepler targets, where the priority list for input surface gravity comes from asteroseismology. There are 17 131 stars in common between APOGEE and Mathur et al. (2017), while with LAMOST, there are 32 547 objects in common. We find a good agreement between log g in APOGEE and the surface gravities revised in Mathur et al. (2017). This is expected as APOGEE surface gravities are calibrated to Kepler seismic log g. The surface gravity for dwarfs stars in LAMOST show an agreement with the gravities derived in Mathur et al. for the Kepler field, while for giants, there is a clear offset and a large scatter of 0.24 dex.
Ho et al. (2017) used the Cannon (Ness et al. 2015) to transfer calibrating information from the APOGEE DR12 survey to determine precise Teff, log g, and [Fe/H] calibration for the spectra of 454 180 LAMOST giants. We find 17 482 stars in common between APOGEE DR14 and the catalog from Ho et al. (2017). The two data-sets agree well in general. The offset in [Fe/H] we found by comparing APOGEE DR14 and LAMOST DR3 is less evident in this new comparison, but the scatter remains similar. Furthermore, the offset in log g is still present, with a scatter of ∼0.2 dex, which is similar to that found between the APOGEE gravities and those found from the LAMOST/Cannon pipeline. The discrepancies in the stellar parameters are nearly independent of the S/N in the APOGEE spectra. However, we find dependences in the discrepancies of the stellar parameters with respect to Teff. For the metal-rich stars, we also find a different trend for the [Fe/H] discrepancies with respect to [Fe/H] in APOGEE DR14. There is also a temperature and metallicity dependence in the calibration from DR12 to DR14. These dependences are also present in the transformation of LAMOST to APOGEE parameters space via the Cannon, but these temperatures and metallicity dependences are weaker than those observed in the transformation from DR12 to DR14. We report no correlation between the DR14 – DR12 discrepancies and DR14 – LAMOST tied to DR12 for Teff, where a correlation would be expected if LAMOST is correctly transferred into APOGEE DR12. We find no correlation either between the [Fe/H] discrepancies, suggesting that LAMOST/Cannon is not entirely in the APOGEE DR12 stellar parameters space, or suggesting that because of the low resolution of LAMOST, the uncertainties in the stellar parameters are large. We also report a [Fe/H] dependence in the calibration applied to the stellar parameters from APOGEE DR12 to DR14. We find a weak correlation between APOGEE DR14 – DR12 and LAMOST on DR12 surface gravity for stars hotter than 4800 K and in the log g range from 2.0 to 2.8 dex, but we do not observe an [Fe/H] dependency in the gravity discrepancies. This correlation arises because both catalogs use seismic gravities from Kepler to calibrate the surface gravity.
Acknowledgments
The authors thank the anonymous referee for the useful comments and suggestions. BA and SRM acknowledge support from National Science Foundation grant AST-1616636. DAGH acknowledges support provided by the Spanish Ministry of Economy and Competitiveness (MINECO) under grant AYA-2017-88254-P. HJ acknowledges support from the Crafoord Foundation and Stiftelsen Olle Engkvist Byggmästare. Support for this work was provided by NASA through Hubble Fellowship grant 51386.01 awarded to R. L. B. by the Space Telescope Science Institute, which is operated by the Association of Universities for Research in Astronomy, Inc., for NASA, under contract NAS 5-26555. SzM has been supported by the Premium Postdoctoral Research Program of the Hungarian Academy of Sciences, and by the Hungarian NKFI Grants K-119517 of the Hungarian National Research, Development and Innovation Office. Funding for the Sloan Digital Sky Survey IV has been provided by the Alfred P. Sloan Foundation, the US Department of Energy of Science, and the Participating Institutions. SDSS-IV acknowledges support and resources from the Center for High-Performance Computing at the University of Utah. The SDSS web site is www.sdss.org. SDSS-IV is managed by the Astrophysical Research Consortium for the Participating Institutions of the SDSS Collaboration including the Brazilian Participation Group, the Carnegie Institution for Science, Carnegie Mellon University, the Chilean Participation Group, the French Participation Group, Harvard- Smithsonian Center for Astrophysics, Instituto de Astrofísica de Canarias, The Johns Hopkins University, Kavli Institute for the Physics and Mathematics of the Universe (IPMU)/University of Tokyo, Lawrence Berkeley National Laboratory, Leibniz-Institut für Astrophysik Potsdam (AIP), Max-Planck-Institut für Astronomie (MPIA Heidelberg), Max-Planck-Institut für Astrophysik (MPA Garching), Max-Planck-Institut für Extraterrestrische Physik (MPE), National Astronomical Observatories of China, New Mexico State University, New York University, University of Notre Dame, Observatorio Nacional/MCTI, The Ohio State University, Pennsylvania State University, Shanghai Astronomical Observatory, United Kingdom Participation Group, Universidad Nacional Autonoma de Mexico, University of Arizona, University of Colorado Boulder, University of Oxford, University of Portsmouth, University of Utah, University of Virginia, University of Washington, University of Wisconsin, Vanderbilt University, and Yale University.
References
- Abolfathi, B., Aguado, D. S., Aguilar, G., et al. 2018, ApJS, 235, 42 [NASA ADS] [CrossRef] [Google Scholar]
- Anguiano, B., Zucker, D. B., Scholz, R.-D., et al. 2015, MNRAS, 451, 1229 [NASA ADS] [CrossRef] [Google Scholar]
- Borucki, W. J., Koch, D., Basri, G., et al. 2010, Science, 327, 977 [NASA ADS] [CrossRef] [PubMed] [Google Scholar]
- Bressan, A., Marigo, P., Girardi, L., et al. 2012, MNRAS, 427, 127 [NASA ADS] [CrossRef] [Google Scholar]
- Casagrande, L., Silva Aguirre, V., Stello, D., et al. 2014, ApJ, 787, 110 [NASA ADS] [CrossRef] [Google Scholar]
- Deng, L.-C., Newberg, H. J., Liu, C., et al. 2012, Res. Astron. Astrophys., 12, 735 [NASA ADS] [CrossRef] [Google Scholar]
- Du, B., Luo, A., Zhang, J., Wu, Y., & Wang, F. 2012, Proc. SPIE, 8451, 845137 [CrossRef] [Google Scholar]
- García Pérez, A. E., Allende Prieto, C., Holtzman, J. A., et al. 2016, AJ, 151, 144 [NASA ADS] [CrossRef] [Google Scholar]
- Ho, A. Y. Q., Ness, M. K., Hogg, D. W., et al. 2017, ApJ, 836, 5 [NASA ADS] [CrossRef] [Google Scholar]
- Holtzman, J. A., Shetrone, M., Johnson, J. A., et al. 2015, AJ, 150, 148 [NASA ADS] [CrossRef] [Google Scholar]
- Huang, Y., Liu, X.-W., Yuan, H.-B., et al. 2015, MNRAS, 449, 162 [NASA ADS] [CrossRef] [Google Scholar]
- Lee, Y. S., Beers, T. C., Sivarani, T., et al. 2008, AJ, 136, 2050 [NASA ADS] [CrossRef] [Google Scholar]
- Luo, A.-L., Zhao, Y.-H., Zhao, G., et al. 2015, Res. Astron. Astrophys., 15, 1095 [NASA ADS] [CrossRef] [Google Scholar]
- Majewski, S. R., Schiavon, R. P., Frinchaboy, P. M., et al. 2017, AJ, 154, 94 [NASA ADS] [CrossRef] [Google Scholar]
- Mathur, S., Huber, D., Batalha, N. M., et al. 2017, ApJS, 229, 30 [NASA ADS] [CrossRef] [Google Scholar]
- Ness, M., Hogg, D. W., Rix, H.-W., Ho, A. Y. Q., & Zasowski, G. 2015, ApJ, 808, 16 [NASA ADS] [CrossRef] [Google Scholar]
- Nidever, D. L., Holtzman, J. A., Allende Prieto, C., et al. 2015, AJ, 150, 173 [NASA ADS] [CrossRef] [Google Scholar]
- Pinsonneault, M. H., Elsworth, Y., Epstein, C., et al. 2014, ApJS, 215, 19 [NASA ADS] [CrossRef] [Google Scholar]
- Ren, A., Fu, J., De Cat, P., et al. 2016, ApJS, 225, 28 [NASA ADS] [CrossRef] [Google Scholar]
- Schönrich, R., & Aumer, M. 2017, MNRAS, 472, 3979 [NASA ADS] [CrossRef] [Google Scholar]
- Skrutskie, M. F., Cutri, R. M., Stiening, R., et al. 2006, AJ, 131, 1163 [NASA ADS] [CrossRef] [Google Scholar]
- Smolinski, J. P., Lee, Y. S., Beers, T. C., et al. 2011, AJ, 141, 89 [NASA ADS] [CrossRef] [Google Scholar]
- Wilson, J. C., Hearty, F., Skrutskie, M. F., et al. 2010, Proc. SPIE, 7735, 77351C [NASA ADS] [CrossRef] [Google Scholar]
- Wu, Y., Luo, A.-L., Li, H.-N., et al. 2011, Res. Astron. Astrophys., 11, 924 [NASA ADS] [CrossRef] [Google Scholar]
- Zamora, O., García-Hernández, D. A., Allende Prieto, C., et al. 2015, AJ, 149, 181 [NASA ADS] [CrossRef] [Google Scholar]
- Zasowski, G., Johnson, J. A., Frinchaboy, P. M., et al. 2013, AJ, 146, 81 [NASA ADS] [CrossRef] [Google Scholar]
- Zasowski, G., Cohen, R. E., Chojnowski, S. D., et al. 2017, AJ, 154, 198 [NASA ADS] [CrossRef] [Google Scholar]
- Zhao, G., Zhao, Y.-H., Chu, Y.-Q., Jing, Y.-P., & Deng, L.-C. 2012, Res. Astron. Astrophys., 12, 723 [CrossRef] [Google Scholar]
All Tables
Offset from the histogram of discrepancies, observed scatter, and sum of uncertainties in the two catalogs for different S/N ranges in the LAMOST survey.
Average discrepancies and standard deviationsin the main stellar parameters for stars in common between APOGEE – SAGA (588 stars) and LAMOST – SAGA (312 stars) in the Kepler field.
Surface gravity average discrepancies and its standard deviation with respect APOGEE (Mathur et al. 2017), and LAMOST (Mathur et al. 2017) in the NASA Kepler field.
All Figures
|
Fig. 1. Hammer–Aitoff projection in Galactic coordinates (l, b) of the APOGEE-LAMOST stellar catalog distribution. Most of the stars are in the North Galactic Pole and in the Galactic anticenter. Note also the Kepler field around l ∼ 70°, b ∼ +15°. |
| In the text | |
|
Fig. 2. Luminosity distribution function in the H band for the APOGEE – LAMOST stellar catalog. The catalog covers a broad magnitude range from 7 to almost 14 mag. Most of the stars are in the magnitude range from 9 to 12 in the H band. |
| In the text | |
|
Fig. 3. Left panel: cumulative histograms of S/N per half-resolution element (approximately a pixel) for APOGEE (solid line) and S/N per pixel for LAMOST (dashed line), as provided from the original catalogs. Right panels: S/N from APOGEE and LAMOST spectra for the common objects as a function of the H-band magnitude from the 2MASS survey. |
| In the text | |
|
Fig. 4. Mean radial velocity uncertainties as a function of the mean S/N for the common stars in APOGEE DR14 and LAMOST DR3. Each point contains 3000 stars. The error bars represent the standard deviation in S/N and the standard error in σRV. |
| In the text | |
|
Fig. 5. Histograms of discrepancies between APOGEE and LAMOST RVs. The distribution shows a mean offset of about 5 km s−1. |
| In the text | |
|
Fig. 6. Mean radial velocity discrepancies with respect to 〈S/N〉, 〈Teff〉, 〈[Fe/H]〉, and 〈log g〉 from APOGEE DR14. No clear systematic trends between the RVs discrepancies and stellar parameters are visible where the amplitude is ≤1 km s−1. |
| In the text | |
|
Fig. 7. Temperature, metallicity, and surface gravity distribution of the APOGEE-LAMOST catalog, using the stellar parameters from APOGEE DR14 (black line), and the parameters reported in LAMOST DR3 (red line). |
| In the text | |
|
Fig. 8. Histograms of discrepancies between effective temperature (upper panel), metallicity (middle panel), and surface gravity (bottom panel) in logarithmic scale. The offset between APOGEE and LAMOST for the surface gravity is clear, as is a substantial scatter of 0.25 dex. See text for details. |
| In the text | |
|
Fig. 9. Teff – log g diagram from APOGEE DR14 (left panel) and LAMOST DR3 (right panel) stellar atmosphere parameters for the stars in common, color-coded by three different ranges in [Fe/H]. Overplotted are 5 Gyr isochrones (Bressan et al. 2012) at [Fe/H] = +0.3, –0.2, and –1.0 dex. The error bars represent the typical uncertainties in Teff and log g in the two surveys. |
| In the text | |
|
Fig. 10. Average uncertainty in Teff, [Fe/H], and log g as a function of the average APOGEE 〈S/N〉 for stars in common in the APOGEE and LAMOST survey. Every point has 1500 stars, and the error bars represent the standard deviation in the S/N bin and the standard error of the mean for Teff, [Fe/H], and log g. |
| In the text | |
|
Fig. 11. Mean effective temperature discrepancies (APOGEE – LAMOST) as a function of 〈S/N〉, 〈Teff〉, 〈[Fe/H]〉, and 〈log g〉. |
| In the text | |
|
Fig. 12. Mean [Fe/H] discrepancies (APOGEE – LAMOST) as a function of 〈S/N〉, 〈Teff〉, 〈[Fe/H]〉, and 〈log g〉. |
| In the text | |
|
Fig. 13. Mean surface gravity discrepancies (APOGEE – LAMOST) with respect to 〈S/N〉, 〈Teff〉, 〈[Fe/H]〉, and 〈log g〉. |
| In the text | |
|
Fig. 14. Histograms of discrepancies for the main stellar atmosphere parameters between the surveys APOGEE – SAGA (black lines) and LAMOST – SAGA (red lines). See text for more details. |
| In the text | |
|
Fig. 15. Discrepancies between the surface gravity derived in APOGEE, LAMOST and Mathur et al. (2017). See text for details. |
| In the text | |
|
Fig. 16. Histograms of discrepancies for the main stellar atmosphere parameters between the APOGEE DR14 and LAMOST tied to APOGEE DR12 via the Cannon. See text for more details. |
| In the text | |
|
Fig. 17. Main stellar parameters discrepancies between APOGEE DR14 and LAMOST, tied to APOGEE DR12 via the Cannon, as a function of 〈S/N〉, 〈Teff〉, 〈[Fe/H]〉, and 〈log g〉 for stars in common. |
| In the text | |
|
Fig. 18. Teff discrepancies between APOGEE DR14 and DR12 with respect to APOGEE DR14 and LAMOST on the APOGEE DR12 stellar parameters space. The three graphics are color-coded by Teff, [Fe/H] and log g from APOGEE DR14. |
| In the text | |
|
Fig. 19. [Fe/H] discrepancies between APOGEE DR14 and DR12 with respect to APOGEE DR14 and LAMOST on the APOGEE DR12 stellar parameters space. The three graphics are color-coded by Teff, [Fe/H], and log g from APOGEE DR14. |
| In the text | |
|
Fig. 20. Surface gravity discrepancies between APOGEE DR14 and DR12 with respect to APOGEE DR14 and LAMOST on the APOGEE DR12 stellar parameters space. The three graphics are color-coded by Teff, [Fe/H], and log g from APOGEE DR14. |
| In the text | |
Current usage metrics show cumulative count of Article Views (full-text article views including HTML views, PDF and ePub downloads, according to the available data) and Abstracts Views on Vision4Press platform.
Data correspond to usage on the plateform after 2015. The current usage metrics is available 48-96 hours after online publication and is updated daily on week days.
Initial download of the metrics may take a while.