Fig. 9.
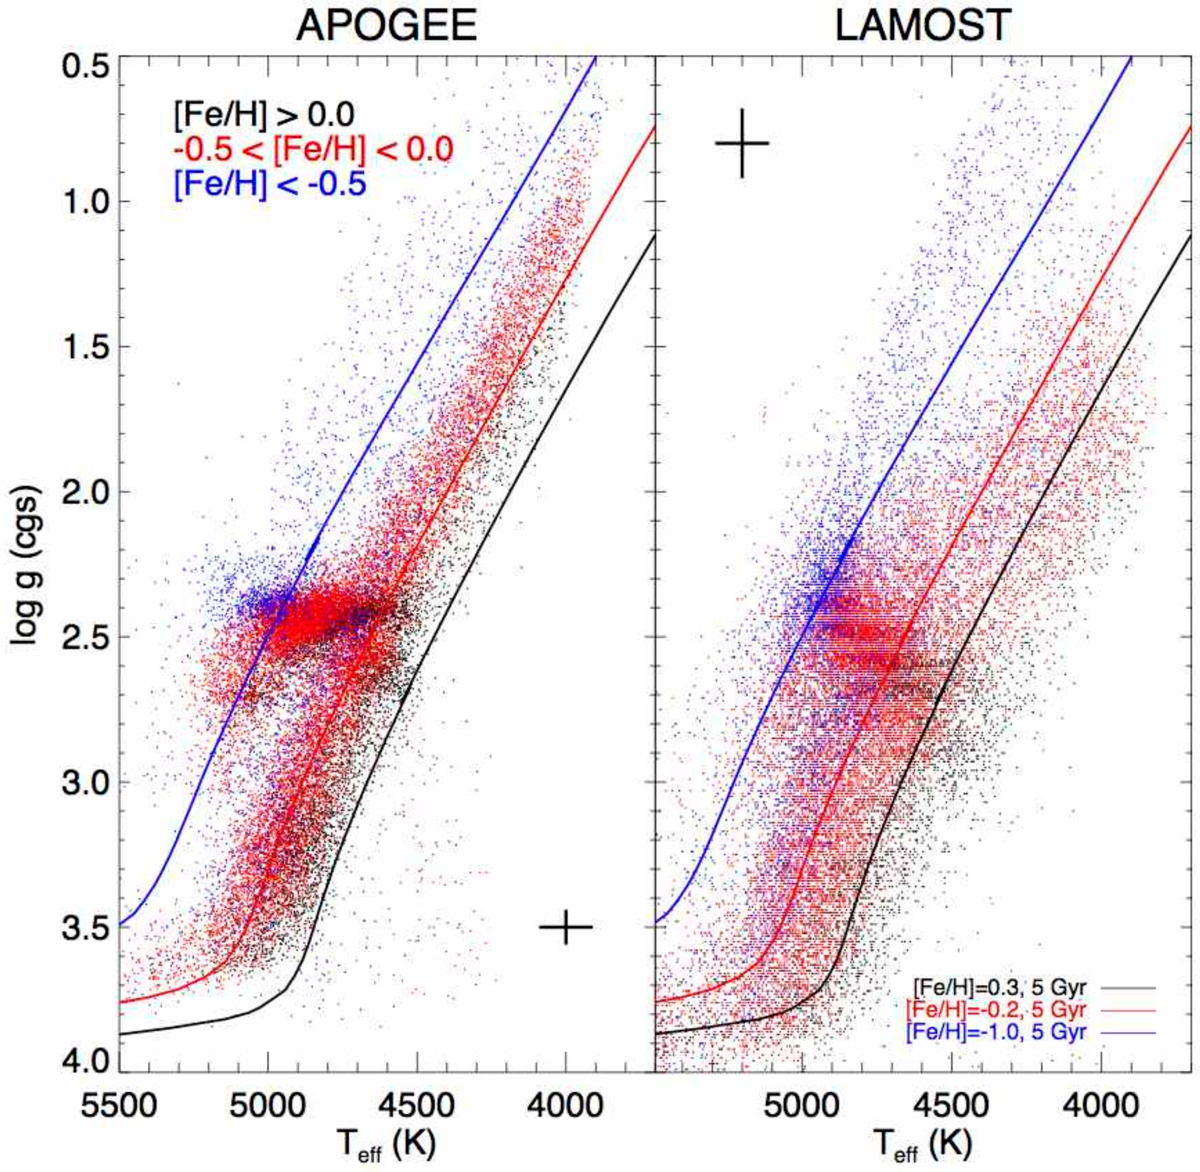
Teff – log g diagram from APOGEE DR14 (left panel) and LAMOST DR3 (right panel) stellar atmosphere parameters for the stars in common, color-coded by three different ranges in [Fe/H]. Overplotted are 5 Gyr isochrones (Bressan et al. 2012) at [Fe/H] = +0.3, –0.2, and –1.0 dex. The error bars represent the typical uncertainties in Teff and log g in the two surveys.
Current usage metrics show cumulative count of Article Views (full-text article views including HTML views, PDF and ePub downloads, according to the available data) and Abstracts Views on Vision4Press platform.
Data correspond to usage on the plateform after 2015. The current usage metrics is available 48-96 hours after online publication and is updated daily on week days.
Initial download of the metrics may take a while.