Fig. 3.
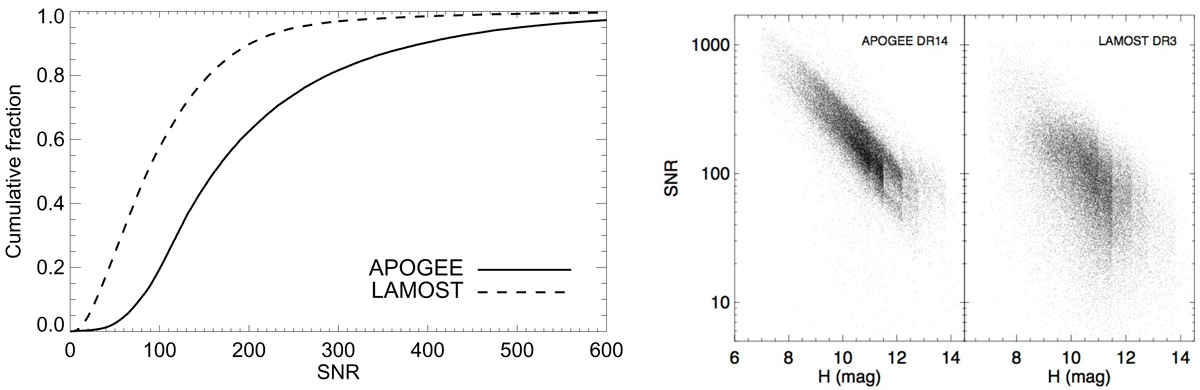
Left panel: cumulative histograms of S/N per half-resolution element (approximately a pixel) for APOGEE (solid line) and S/N per pixel for LAMOST (dashed line), as provided from the original catalogs. Right panels: S/N from APOGEE and LAMOST spectra for the common objects as a function of the H-band magnitude from the 2MASS survey.
Current usage metrics show cumulative count of Article Views (full-text article views including HTML views, PDF and ePub downloads, according to the available data) and Abstracts Views on Vision4Press platform.
Data correspond to usage on the plateform after 2015. The current usage metrics is available 48-96 hours after online publication and is updated daily on week days.
Initial download of the metrics may take a while.