| Issue |
A&A
Volume 619, November 2018
|
|
|---|---|---|
| Article Number | A178 | |
| Number of page(s) | 13 | |
| Section | Stellar atmospheres | |
| DOI | https://doi.org/10.1051/0004-6361/201833953 | |
| Published online | 21 November 2018 | |
High-resolution abundance analysis of four red giants in the globular cluster NGC 6558★,★★
1
Universidade de São Paulo, IAG, Rua do Matão 1226, Cidade Universitária,
São Paulo 05508-900, Brazil
e-mail: This email address is being protected from spambots. You need JavaScript enabled to view it.
2
Dipartimento di Fisica e Astronomia, Università di Padova,
35122 Padova, Italy
3
INAF – Osservatorio Astronomico di Padova,
Vicolo dell’Osservatorio 5,
35122 Padova, Italy
4
European Southern Observatory, Alonso de Córdova 3107,
Santiago, Chile
5
Facultad de Ciencias Exactas, Universidad Andrés Bello,
Av. Fernández Concha 700,
Las Condes, Santiago, Chile
6
Universidade Estadual de Santa Cruz, DCET,
Rodovia Jorge Amado km 16, Ilhéus 45662-000, Bahia, Brazil
7
Departamento de Astronomia, Universidade Federal do Rio Grande do Sul,
CP 15051,
Porto Alegre 91501-970,
Brazil
8
Centre for Astrophysics and Supercomputing, Swinburne University of Technology,
Hawthorn,
Victoria 3122, Australia
9
INAF – Osservatorio Astronomico di Padova,
vicolo dell’Osservatorio 5,
35122 Padova, Italy
Received:
25
July
2018
Accepted:
13
September
2018
Abstract
Context. NGC 6558 is a bulge globular cluster with a blue horizontal branch (BHB), combined with a metallicity of [Fe/H] ≈ −1.0. It is similar to HP 1 and NGC 6522, which could be among the oldest objects in the Galaxy. Element abundances in these clusters could reveal the nature of the first supernovae.
Aims. We aim to carry out detailed spectroscopic analysis for four red giants of NGC 6558, in order to derive the abundances of the light elements C, N, O, Na, Al, the α-elements Mg, Si, Ca, Ti, and the heavy elements Y, Ba, and Eu.
Methods. High-resolution spectra of four stars with FLAMES-UVES at VLT UT2-Kueyen were analysed. Spectroscopic parameter-derivation was based on excitation and ionization equilibrium of Fe I and Fe II.
Results. This analysis results in a metallicity of [Fe/H] = − 1.17 ± 0.10 for NGC 6558. We find the expected α-element enhancements in O and Mg with [O/Fe] = +0.40, [Mg/Fe] = +0.33, and low enhancements in Si and Ca. Ti has a moderate enhancement of [Ti/Fe] = +0.22. The r-element Eu appears very enhanced with a mean value of [Eu/Fe] = +0.63. The first peak s-elements Y and Sr are also enhanced, these results have however to be treated with caution, given the uncertainties in the continuum definition; the use of neutral species (Sr I, Y I), instead of the dominant ionized species is another source of uncertainty. Ba appears to have a solar abundance ratio relative to Fe.
Conclusions. NGC 6558 shows an abundance pattern that could be typical of the oldest inner bulge globular clusters, together with the pattern in the similar clusters NGC 6522 and HP 1. They show low abundances of the odd-Z elements Na and Al, and of the explosive nucleosynthesis α-elements Si, Ca, and Ti. The hydrostatic burning α-elements O and Mg are normally enhanced as expected in old stars enriched with yields from core-collapse supernovae, and the iron-peak elements Mn, Cu, Zn show low abundances, which is expected for Mn and Cu, but not for Zn. Finally, the cluster trio NGC 6558, NGC 6522, and HP 1 have relatively high abundances of first-peak heavy elements, variable second-peak element Ba, and the r-element Eu is enhanced. The latter is particularly high in NGC 6558.
Key words: stars: abundances / Galaxy: bulge / globular clusters: individual: NGC 6558
Observations collected at the European Southern Observatory, Paranal, Chile (ESO), under programme 93.D-0123A.
Tables A1 and A2 (Equivalent widths and Atomic data) are only available at the CDS via anonymous ftp to cdsarc.u-strasbg.fr (130.79.128.5) or via http://cdsarc.u-strasbg.fr/viz-bin/qcat?J/A+A/619/A178
© ESO 2018
1 Introduction
Globular clusters in the Galactic bulge are probes of the formation processes of the central parts of the Galaxy. The first dwarf-like galaxies were likely the formation-sites of the earliest globular clusters, and they were subsequently incorporated in the halo and bulge of galaxies such as the Milky Way (Nakasato & Nomoto 2003; Boley et al. 2009; Tumlinson 2010; Bromm & Yoshida 2011). Therefore, metal-poor inner bulge globular clusters might be relics of an early generation of long-lived stars formed in the proto-Galaxy.
Barbuy et al. (2018a) report a concentration and even dominance of clusters with [Fe/H] approximately −1.00 within about 10° of the Galactic centre. A metallicity of −1.3 ≲ [Fe/H] ≲−1.0 is compatible with the lowest metallicities of the bulk of stellar populations in the Galactic bulge, as shown by the metallicity distribution of bulge stars by Zoccali et al. (2008, 2017), Hill et al. (2011), Ness et al. (2013), and Rojas-Arriagada et al. (2014, 2017). This is due to a fast chemical enrichment in the Galactic bulge, as discussed in Chiappini et al. (2011), Wise et al. (2012) and Cescutti et al. (in prep.). Very low fractions of more metal-poor stars were found so far (e.g. García-Perez et al. 2013, Casey & Schlaufman 2015, Howes et al. 2016; Koch et al. 2016) – see also the discussion in Barbuy et al. (2018a).
Therefore, it is crucial to study such moderately metal-poor clusters ([Fe/H] approximately −1.0) located in the Galactic bulge, in order to further identify their signatures, which correspond to the earliest stages of the Galacticbulge formation. Their chemical abundances can reveal the nature of the first massive stars and supernovae.
One candidate Milky Way relic is NGC 6558, which has a blue horizontal branch (BHB), together with a metallicity of [Fe/H] approximately −1.0 (Rich et al. 1998; Barbuy et al. 2007), with characteristics very similar to NGC 6522 (Barbuy et al. 2009, 2014; Ness et al. 2014), and HP 1 (Barbuy et al. 2006, 2016). The trio NGC 6558, NGC 6522, and HP 1 are the main representatives of such clusters in the inner 6° of the Galactic bulge, as can be seen in the classification given in Barbuy et al. (2009) – see also Bica et al. (2016). Their combined features indicate a very old age. The ages of NGC 6522 and HP 1 were recently confirmed to be very old, calculated to be around 13 Gyr by Ortolani et al. (2011) and Kerber et al. (2018a,b).
The cluster NGC 6558 is projected on the Galactic bulge, in a field described as an extended clear region by Blanco (1988). The equatorial coordinates are (J2000) α = 18h 10m18.4s, δ = −31°45′49′′, and the Galactic coordinates are l = 0.201°, b = −6.025°. NGC 6558 is very concentrated, with post-core collapse structure, a core radius of rc = 2′′ and a half light radius rh = 129′′ according to Trager et al. (1995). In Rossi et al. (2015), NGC 6558 was studied with a set of subarcsec (~0.5′′) seeing images obtained at the New Technology Telescope (NTT), with a time difference of 19 yr. This has allowed us to apply proper motion decontamination, with high accuracy, and a reliable selection of member stars. Using the proper motion determinations by Rossi et al. (2015), combined with the radial velocity from high-resolution spectroscopy by Barbuy et al. (2007) and heliocentric distance from literature (Bica et al. 2006), Pérez-Villegas et al. (2018) carried out an orbital analysis of NGC 6558 in a bulge/bar Galactic potential and with a Monte Carlo method, taking into account the uncertainties in the observational parameters. The cluster shows a pro-grade orbit, with peri-galactic and apo-galactic distances of ~0.13 and ~2.50 kpc, respectively, and a maximum height of ⟨|z|max⟩ ~ 1.4 kpc, pointing out that the cluster is confined in the innermost Galactic region with a bar-shape in the x–y projection, and boxy-shape in the x–z projection (in a frame co-rotating with the bar), indicating that NGC 6558 is trapped by the Galactic bar.
In Barbuy et al. (2007), we carried out a detailed abundance analysis of five stars with spectra obtained with the GIRAFFE spectrograph at the Very Large Telescope (VLT), from the ESO projects 71.B-0617A, 73.B0074A (PI: A. Renzini; see Zoccali et al. 2008). A mean metallicity of [Fe/H] = −0.97 ± 0.15 was obtained for NGC 6558. From CaT triplet lines based on FORS2 at VLT spectra, for a sample of 28 globular clusters, Saviane et al. (2012) derived [Fe/H] = −1.03 ± 0.14 for NGC 6558. Based on FORS2 at VLT spectra in the optical, Dias et al. (2015, 2016) derived metallicities for 51 globular clusters, including the same stars in the same clusters as in Saviane et al. (2012). A method of full spectrum fitting from observations in the 4600–5600 Åregion was carried out. Recalling that the results depend crucially on the library of spectra adopted, the final metallicity of [Fe/H] = −1.01 ± 0.10 for NGC 6558 was obtained essentially with the use of a library of synthetic spectra (Coelho et al. 2005).
In this work we present results from spectra obtained for four stars with the FLAMES-UVES spectrograph at the VLT, at a resolution R ~ 45 000. A detailed abundance analysis of the sample stars was carried out using MARCS model atmospheres (Gustafsson et al. 2008).
Photometric and spectroscopic data are described, respectively, in Sects. 2 and 3. Photometric stellar parameters effective temperature and gravity are derived in Sect. 4. Spectroscopic parameters are derived in Sect. 5 and abundance ratios are computed in Sect. 6. Results are discussed in Sect. 7 and conclusions are drawn in Sect. 8.
Log of photometric observations, carried out on 20–21 May 2012 at the NTT.
2 Photometric observations
Colour-magnitude diagrams (CMDs) for NGC 6558 were presented by Rich et al. (1998) in V vs. V –I, and in the near-infrared (NIR) by Davidge et al. (2004) in K vs. J–K diagrams. Davidge et al. (2004) estimated a metallicity of [Fe/H] = −1.5 ± 0.5, from Flamingos-I spectra of resolution of R = 350, obtained with the Gemini-South telescope. We carried out a membership check for their brightest stars, and found that their star #5 should be a member, located at the very tip of the red giant branch at V–I = 2.55; star #11 is saturated in our images, and could not be verified for membership. More recently, NGC 6558 has been further studied in the near-infrared by Chun et al. (2010), and in the optical by Alonso-García et al. (2012).
In Rossi et al. (2015) a proper-motion cleaned CMD of NGC 6558 was produced, where the first epoch observations of NGC 6558 were taken in June 15, 1993, and the second epoch data in May 20, 2012. Therefore, a time baseline of 19 yr is available for proper motion decontamination.
In the present work, we give further detail on the NTT data and reductions, beyond those given in Rossi et al. (2015), where data and reductions were only briefly described and reported in their Table 1. For the first epoch, we used NTT at the European Southern Observatory – ESO (La Silla) equipped with EMMI in the focal reducer mode. The red arm and the 2024 × 2024 pixels LoralUV-coated CCD ESO # 34 detector were employed. The pixel size is 15 μm, corresponding to 0.35′′, with a full field of 11.8′ × 11.8′. The log of these observations can be found in Rich et al. (1998).
For the second epoch, we used NTT equipped with EFOSC2, with CCD ESO # 40, UV-flooded, MPP, and 2048 × 2048 pixels, with pixel size of 15 μm, corresponding to 0.12′′ /pixel, binned in two by two. The full field is 4.1′ × 4.1′. The log of NTT 2012 observations is given in Table 1.
We have measured 20 Landolt stars during the two photometric nights used to define the calibration transformations, and some of them have been observed repeatedly. Daophot II was used to extract the instrumental magnitudes. These magnitudes have been calibrated using Landolt stars (Landolt 1983, 1992), resulting in
for exposure times of 15 s and airmasses of 1.15. Due to crowding effects the transfer of the aperture magnitudes from standards to the field stars gives an additional ±0.03 mag, and the final magnitude zero point uncertainty amounts to ±0.04. The atmospheric extinction was corrected with the standard La Silla coefficients for EFOSC2 (CV = 0.16, CI = 0.08 mag airmass−1).
The present proper motion measurements were based on the two best seeing second epoch sets of images. We used the remaining images for a test on photometric error effects.
In Fig. 1, we show an image of NGC 6558 combining J, Y, Z filters, from the Vista Variables in the Via Lactea (VVV1; Saito et al. 2012) survey; the four sample stars, and the more central RR Lyrae stars identified in the Optical Gravitational Lensing Experiment (Udalski et al. 2002; Soszyński et al. 2014) OGLE2 are overplotted.
In Fig. 2, we give a V vs. V –I proper-motion-cleaned CMD (calibrated to the NTT 2012 data), together with the BaSTI α -enhanced 13 Gyr, [Fe/H] = −1.0, and primordial helium (Y = 0.25) isochrone fit (Pietrinferni et al. 2004). The four sample stars and the seven more central RR Lyrae from OGLE are identified. As can be seen, the four sample stars are red giant branch (RGB) stars, and the RR Lyrae populate the instability strip of the horizontal branch (HB). The BaSTI isochrones employed are suitable to the subgiant and red giant branch (SGB-RGB), and a separate isochrone suitable to the zero-age horizontal branch (ZAHB) is included.
Reddening and distance values for NGC 6558 have been found to be rather different among authors. In Table 2, we report values of V magnitude of the Horizontal Branch VHB, reddening, distance modulus and distances adopted in the literature (Terndrup 1988; Hazen 1996; Rich et al. 1998; Davidge et al. 2004; Barbuy et al. 2007; Rossi et al. 2015), together with the presently derived values. In a pioneer work Terndrup (1988) derived reddening and proper motion values for fields along the bulge minor axis, including the NGC 6558 location at −6°. Distances of d⊙ = 6.6 and 6.3 kpc were found, respectively, by Hazen (1996) and Rich et al. (1998). A revised distance taking into account an updated absolute magnitude of the HB versus metallicity relation by Harris (1996, updated in 2010)3 yields E(B–V) = 0.44 and a distance to the Sun of d⊙ = 7.4 kpc. Davidge et al. (2004) adopt E(B–V) = 0.44. Barbuy et al. (2007) use photometric data from the 2.2 m MPI telescope at ESO, and obtain a magnitude of the HB level at VHB = 15.5.
Alonso-García et al. (2012) analyse the differential reddening in NGC 6558, relative to a ridge line (not the absolute values). For a mean reddening value the authors adopt a value from Schlegel et al. (1998), that is overestimated in particular in the central regions, because it measures the dust integrated in the line of sight all along the extent of the Galaxy. Therefore, these authors’ mean value of E(B–V) = 0.51 appears to be too high – see literature values in Table 2. Alonso-García et al. (2012) find that NGC 6558 is a difficult case (their Sect. 4.18), and they could not get a significant de-reddening improvement, due to the cluster being very contaminated. Their method is also affected by stars with different reddening along the line of sight.
Rossi et al. (2015) use the 1993 NTT data combined with the 2012 NTT data, and from these data a HB level at VHB = 16.0, a distance modulus of (m−M)0 = 14.43, AV = 1.178, and a distance of d⊙ = 7.4 kpc was obtained. Conversion factors for E(V –I)∕E(B–V) range from 1.31 (Dean et al. 1978), 1.38 (Schlegel et al. 1998) to 1.40 (Schlafly & Finkbeiner 2011). Schlegel et al. (1998) gives E(V –I) = 0.53 towards NGC 6558, this being an upper limit, since it is measured all along the line of sight. OGLE reddening maps give E(V –I) = 0.54 (Nataf et al. 2013), Rich et al. (1998) derived E(V –I) = 0.60, and Harris (1996, updated in 2010) reports E(B–V) = 0.44. In the present work we identified the HB at V (HB) = 16.37, and find E(V –I) = 0.50 (Table 2), which together with reddening law values of E(V –I)∕E(B − V) = 1.33, and a total-to-selective absorption RV = 3.1, give a V -band extinction of AV = 1.17, and a distance of d⊙ = 8.26 kpc (Table 2), farther than in previous measurements.
An additional constraint to the cluster distance can be obtained from the RR Lyrae. According to the MV–[Fe/H] relation derived by the Gaia Collaboration (2017), RR Lyrae stars with [Fe/H] = −1.17 (Sect. 5, Table 6), have MV ~ 0.65 ± 0.10. Assuming the average V magnitude for the RR Lyrae stars of ⟨V⟩ ~ 16.40, and our reddening AV = 1.165, we obtain exactly the same intrinsic distance modulus values presented in Table 2, of (m–M)0 ~ 14.585. This shows that the distances from both methods, that is, isochrone fit and RR Lyrae stars, are converging. The uncertainty in the MV of ±0.10 leads to an uncertainty of ±0.10 in (m–M)0, and an uncertainty of  kpc in the distance.
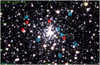 |
Fig. 1 VVV image of NGC 6558 in combined JY Z colours, in size of 3.6′× 2.4′. The four sample stars are identified as red filled circles, and RR Lyrae from OGLE are identified by cyan filled circles. |
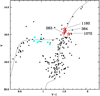 |
Fig. 2 V vs. V – I colour–magnitude diagram of NGC 6558 from NTT 2012 data. The four sample stars are shown as red stars, and RR Lyrae are shown as green filled circles. A BaSTI isochrone for an age of 13 Gyr, [Fe/H] = −1.0 and primordial helium abundance (Y = 0.25) is overplotted. |
Literature HB level, reddening, and distance for NGC 6558.
Log of the spectroscopic observations.
Identifications, positions, and magnitudes.
3 Spectroscopic observations
The spectra of individual stars of NGC 6558 were obtained at the VLT using the UVES spectrograph (Dekker et al. 2000), in FLAMES-UVES mode. The red chip (5800–6800 Å) uses ESO CCD # 20, an MIT backside illuminated, of 4096 × 2048 pixels, and pixel size 15 × 15 μm. The blue chip (4800–5800 Å) uses ESO Marlene EEV CCD#44, backside illuminated, of 4102 × 2048 pixels, and pixel size 15 × 15 μm. The UVES standard setup 580 yields a resolution R ~ 45 000 for a 1 arcsec slit width. The pixel scale is 0.0147 Å pix−1, with ~7.5 pixels per resolution element at 6000 Å.
The data were reduced using the UVES pipeline, within ESO/Reflex software (Ballester et al. 2000; Modigliani et al. 2004). The log of the 2014 observations are given in Table 3. The spectra were flatfielded, optimally extracted and wavelength calibrated with the FLAMES-UVES pipeline.
The present UVES observations centred at 5800 Å yield a spectral coverage of 4800 < λ < 6800 Å, with a gap at 5708–5825 Å. The final signal-to-noise ratio (S/N) resulted in values of S∕N ~ 100 in the red portion, andS∕N ~ 70 in the blue portion. The selected stars, their OGLE and 2MASS designations, coordinates, and V, I magnitudes from the NTT 2012 data presented here, together with the 2MASS JHKs (Skrutskie et al. 2006), and VVV JHKs magnitudes (Saito et al. 2012), are listed in Table 4.
We derived radial velocities using the IRAF/FXCOR task for all individual observations in each run, adopting as template the Arcturus spectrum (Hinkle et al. 2000). The present mean heliocentric radial velocity v = −194.45 ± 2.1 km s-1 is in very good agreement with the value of v
 = −197.3 ± 4.0 km s-1 derived from five giants stars observed with the GIRAFFE spectrograph (Barbuy et al. 2007), and −198.0 ± 4.0 km s-1 derived by Saviane et al. (2012) from four stars. Spectra extracted from different frames were then co-added, taking into account the radial velocities reported in Table 5.
Radial velocities of the UVES sample stars, in each of the six exposure runs, corresponding heliocentric radial velocities and mean heliocentric radial velocity.
Photometric stellar parameters derived using the calibrations by Alonso et al. (1999) for V – I, V – K, J– K, bolometric corrections, bolometric magnitudes and corresponding gravity log g, and final spectroscopic parameters.
Mean abundances of odd-Z elements Na, Al, α-elements O, Mg, Si, Ca, Ti, and the heavy elements Eu, Ba, Y, Sr.
Abundance uncertainties for star N6558:283, for uncertainties of ΔTeff = 100 K, Δlog g = 0.2, Δ vt = 0.2 km s−1 and corresponding total error.
4 Photometric stellar parameters
4.1 Temperatures
V IJHKs magnitudes are given in Table 4. V and I magnitudes from the NTT 2012 observations, 2MASS J, H, and Ks from Skrutskie et al. (2006)4 and VVV J, H, and Ks from the VVV survey (Saito et al. 2012), were adopted. Reddening laws from Dean et al. (1978) and Rieke & Lebofsky (1985), namely, RV = AV /E(B–V) = 3.1, E(V –I)/E(B–V) = 1.33, E(V –K)/E(B–V) = 2.744, E(J–K)/E(B–V) = 0.527 were used.
Effectivetemperatures were derived from V –I using the colour–temperature calibrations of Alonso et al. (1999). For the transformation of V – I from Cousins to Johnson system we used V –IC = 0.778(V –IJ) as given in Bessell (1979). The VVV JHKs colours were transformed to the 2MASS JHKs system, using relations by Soto et al. (2013). For the effective temperatures derived from the V – K, and J– K 2MASS and VVV colours we used the relations by Gonzalez Hernandez & Bonifacio (2009). It seems that some magnitudes are not adequate, in particular the 2MASS Ks for star 283.The photometric effective temperatures derived are listed in Table 6.
4.2 Gravities
The following classical relation was used to derive gravities
 (1)
(1)
For NGC 6558, the NTT 2012 photometry gives AV = 1.17 and (m–M)° = 14.58. We adopted T⊙ = 5770 K, Mbol⊙ = 4.75, and M* = 0.85 M⊙. The bolometric corrections computed with relations from Alonso et al. (1999), and corresponding gravities are given in Table 6. The photometric parameters were adopted as an initial guess in order to proceed with the analysis of the spectroscopic data for the derivation of the final stellar parameters, as described in the next section.
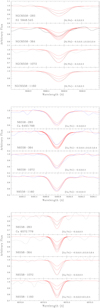 |
Fig. 3 SiI 5948.545, CaI 6493.788, and CaI 6572.779 Å lines in the four sample stars. Calculations for different [Si/Fe] and [Ca/Fe] are shown, with values as indicated in each panel. |
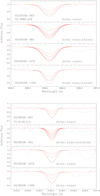 |
Fig. 4 TiI 5866.449 and 6126.214 Å lines in the four sample stars. Calculations for different [Ti/Fe] are shown, with values as indicated in each panel. |
5 Spectroscopic stellar parameters
The equivalent widths (EW) were initially measured using the automatic code DAOSPEC, developed by Stetson & Pancino (2008). We also measured all lines manually using IRAF. The Fe II lines adopted were all measured by hand using IRAF, given that DAOSPEC is unable to take subtle blends into account. To rely on the Fe II lines to derive the gravities, we compared the observed and synthetic lines, and eliminated the not clearly present lines in the observed spectra. For the Fe I and Fe II lines, the oscillator strengths and EWs are reported in Table A.1 to be published electronically only. The wavelengths, excitation potentials and oscillator strengths were gathered from the line lists by Kurúcz (1993) websites5 ,6, the National Institute of Standards & Technology (NIST, Martin et al. 2002)7, and VALD (Piskunov et al. 1995). Oscillator strengths for the Fe II lines are from Meléndez & Barbuy (2009).
Atomic constants (log gf and van der Waals damping constants, and hyperfine structure) were adopted after checking the fits to lines in the solar spectrum with the same UVES at VLT instrumentation as the present data8, the Arcturus spectrum (Hinkle et al. 2000), and the metal-rich star μ Leo (Lecureur et al. 2007), as explained in previous papers (Barbuy et al. 2006, 2014; Trevisan & Barbuy 2014, among others).
Photospheric 1D models for the sample giants were extracted from the MARCS model atmospheres grid (Gustafsson et al. 2008). The LTE abundance analysis and the spectrum synthesis calculations were performed using the code described in Barbuy et al. (2003, 2018b) and Coelho et al. (2005). A solar iron abundance of ϵ (Fe) = 7.50 (Grevesse & Sauval 1998) was adopted. Molecular lines of CN (A2 Π–XΣ), C2 Swan (A3 Π–X3Π), TiO (A3 Φ–X3Δ) γ and TiO (B3 Π–X3Δ) γ ’ systems are taken into account in the studied wavelength region.
The stellar parameters were derived by initially adopting the photometric effective temperature and gravity, and then further constraining the temperature by imposing excitation equilibrium for Fe I lines. The selected Fe II lines measurable, allowed to derive gravities imposing ionization equilibrium, noting that their EWs are uncertain due to continuum placement inaccuracy. For this reason, we have over-plotted the computed and observed Fe II lines, and selected only those identified to be not blended. Microturbulence velocities vt were determined by canceling the trend of Fe I abundance vs. equivalent width.
The final spectroscopic parameters Teff, log g, [Fe I/H], [Fe II/H], [Fe/H] and vt values are reported in the last columns of Table 6. We have adopted the spectroscopic parameters for the derivation of elemental abundances.
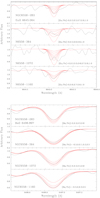 |
Fig. 5 EuII 6645.064 and BaII 6496.897 Å lines in the four sample stars. Calculations for different [Eu/Fe] and [Ba/Fe] are shown, with values as indicated in each panel. |
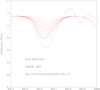 |
Fig. 6 EuII 6347.640 Å in star 283. |
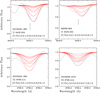 |
Fig. 7 YI 6435.004 and YII 6795.414 Å lines in stars 283, 364 and 1072. Calculations for different [Y/Fe] are shown, with values as indicated in each panel. |
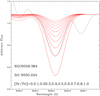 |
Fig. 8 SrI 6550.244 Å line in star 364. Calculations for different values of [Sr/Fe] as indicated in the panel are shown. |
6 Element abundances
Abundances were obtained by means of line-by-line spectrum synthesis calculations compared with the observed spectra. The hyperfine structure (HFS) for the studied lines of Ba II and Eu II were taken into account.
In Table A.2 we report the line-by-line abundances for the light elements C, N, O, the odd-Z elements Na, Al, the α -elements Mg, Si, Ca, Ti, and the heavy elements Ba, Y, Sr, and Eu abundances, given electronically only. In Table 7, we give the final abundances for each star, and the mean abundances for the cluster.
The carbon abundances were estimated from the C2 (0,1) bandhead at 5635.3 Å of the Swan d3 Π g–a3Πu system, using the laboratory line list from Phillips & Davis (1968). The N abundances were derived from the CN (5,1) bandhead at 6332.2 Å of the CN A2 Π–X2Σ red system, using laboratory line lists by Davis & Phillips (1963). Both these bandheads are weak and indicate only an upper limit for the S/N of these spectra. The forbidden [OI] 6300.311 Å line was used to derive the oxygen abundances, taking into account the estimated C and N abundances iteratively. The C, N, and O abundances are given in Table A.2. The abundance derivation of the elements Na, Al, Mg, Si, Ca, and Ti followed the usual procedures and line lists (e.g. Barbuy et al. 2016). Examples of fits of synthetic spectra to the observed lines are shown in Figs. 3 and 4.
Fits to EuII 6645.063 and BaII 6496.897 Å, lines are shown in Fig. 5. Eu was derived from the Eu II 6645.064 Å, showing all high values. The lines Eu II 6173.029 Å, Eu II 6437.640 Å were also inspected. The former is blended and would in any case indicate an even higher Eu abundance. The latter is compatible with the abundances obtained from the Eu II 6645.064 Å line, as can be seen in Fig. 6 in star 283 (for the other three stars there are defects in the spectra). The heavy element Y was derived only for three stars from the Y II 6795.414 Å line, and also from Y II 6435.004 Å for one star; Sr was derived for one star from one line. As can be seen from Figs. 7 and 8 these results must be taken with caution. Finally, La remains undefined given that although the La II 6172.721 Å line indicates [La/Fe] aprroximately +1.0 for two sample stars, the region shows unidentified blends, whereas La II 6320.276 Å and La II 6390.477 Å give considerably lower values; La II 6262.287 Å has defects in all four stars; besides, if La is high this would be in contrast with a low Ba, and not compatible with the results from Barbuy et al. (2007), so that we prefer not to report final values for La.
Errors. The errors due to uncertainties in spectroscopic parameters are given in Table 8, applied to the sample star NGC 6558:283. We have adopted the usual errors as for similar samples (Barbuy et al. 2014, 2016): ±100 K in effective temperature, ±0.2 on gravity, and ±0.2 km s−1 on the microturbulence velocity. Errors are computed by computing models with these modified parameters, with changes of Δ Teff = +100 K, Δ log g = +0.2, Δ vt = 0.2 km s−1, and recomputinglines of different elements. The error given is the abundance difference needed to reach the adopted abundances. A total error estimate is given in Col.5 of Table 8. Additionally, there is uncertainty in the continuum placement that we estimate to be of 0.1 dex, and the total final error is reported in Col. 6. Other uncertainties for similar stars, such as non-LTE effects are discussed more extensively in Ernandes et al. (2018).
7 Discussion
We deriveda mean metallicity of [Fe/H] = −1.17 ± 0.10 for NGC 6558, about 0.2 dex below the results from Barbuy et al. (2007) from lower resolution GIRAFFE spectra. Uncertainties in the continuum placement in the present spectra, in particular in the measuremente of Fe II lines, mean that this metallicity could be slightly underestimated. The UVES spectra, having higher resolutions, should be more accurate than the GIRAFFE ones, given that resolution is more important than S/N (Cayrel 1988). Even so there are difficulties in reliably measuring the Fe II lines.
The odd-Z elements Na and Al show a different behaviour from each other. Na shows no enhancements relative to the solar ratio, and it is even deficient in one star, whereas Al is enhanced in two stars. In the mean Na shows essentially a solar ratio with [Na/Fe] approximately −0.03, and Al is slightly enhanced with [Al/Fe] = +0.15. Despite the small size of the sample, in Fig. 9 we show [Na/Fe] vs. [O/Fe], [Al/Fe] vs. [O/Fe], [Al/Fe] vs. [Mg/Fe] and [Al/Fe] vs. [Na/Fe], to check if the expected anti-correlations Na-O, Al-O, Al-Mg, Al-Na are seen (Carretta et al. 2009; Renzini et al. 2015). In this figure are also added the stars analysed in Barbuy et al. (2007). Looking at the present results, anti-correlations Al-O and Al-Mg might be present, but in the overall none seems clear. Let us add that NGC 6558 has an absolute magnitude of MV = −6.44 (Harris 1996), a little less massive than M4 (NGC 6121) with MV = −7.19, the latter clearly showing such anti-correlations. In conclusion, further data are needed for NCG 6558, both spectroscopy for larger samples, as well as UV photometry as carried out in Piotto et al. (2015), in order to identify second-generation stars in this cluster.
The “bona-fide” α-elements O and Mg, produced in hydrostatic phases of massive stars, with enhancements of [O/Fe] = +0.40 and [Mg/Fe] = +0.33, indicate that they were enriched early in the Galaxy. Si and Ca instead, that form mainly in explosive nucleosynthesis in SN type II (Woosley & Weaver 1995; Woosley et al. 2002), tend to be rather low, with [Si/Fe] = +0.11, and [Ca/Fe] = +0.07. The same pattern was found for NGC 6522, with [Si/Fe] = +0.13, and [Ca/Fe] = +0.13 (Barbuy et al. 2014), and HP 1, with [Si/Fe] = +0.27, and [Ca/Fe] = +0.13 (Barbuy et al. 2016). As for Ti that is in fact an iron-peak element, but behaves very similarly to Si, Ca, the similarity with the other two clusters is also found: [TiI/Fe] = +0.21, [TiII/Fe] = +0.24 in NGC 6558, [TiI/Fe] = +0.16, [TiII/Fe] = +0.21 in NGC 6522, and [TiI/Fe] = +0.04, [TiII/Fe] = +0.17 in HP 1.
This indicates that the moderately metal-poor clusters in the Galactic bulge appear to show a typical abundance pattern. The elements Si, Ca, and Ti have lower abundances relative to O and Mg; this difference is more pronounced than in bulge field stars, where Si, Ca, and Ti tend to show abundances of about 0.1 dex lower than those of O and Mg (e.g. McWilliam 2016; Bensby et al. 2017; Friaça & Barbuy 2017; Barbuy et al. 2018a). The iron-peak elements were derived for these stars in Ernandes et al. (2018).
As for the heavy elements, we compared the present results with available literature abundances of heavy elements in bulge field stars, and results for NGC 6558 from Barbuy et al. (2007), and other globular clusters: a) Johnson et al. (2012) derived abundances of Eu in common with the present element abundance derivation. Their observations concern red giants in Plaut’s field, located at l = −1°, b = −8°, and l = −1°, b = −8. °5, and their stars have metallicities in the range −1.6 ≤ [Fe/H] ≤ +0.5; b) Siqueira-Mello et al. (2016) analysed five stars indicated to have metallicities around [Fe/H] approximately −0.8 in the ARGOS survey (Ness et al. 2013). Abundances of the heavy elements Y, Zr, La, Ba, and Eu were derived; c) Bensby et al. (2017) present element abundances of 90 microlensed bulge dwarfs and subgiants. Their study includes the abundances of the heavy elements Y and Ba; d) van der Swaelmen et al. (2016) derived abundances of Ba, La, Ce, Nd and Eu for 56 bulge field giants; e) five stars in NGC 6558 from Barbuy et al. (2007), where abundances of Ba, La and Eu were derived; f) as for other globular clusters, results for the similar clusters NGC 6522 (Barbuy et al. 2014), and HP 1 (Barbuy et al. 2016) are included, as well as M62 (NGC 6266), projected towards the bulge, studied by Yong et al. (2014).
In Fig. 10, we plot the present results for the heavy elements Y, Ba, and Eu-over-Fe for the four sample stars, compared with the above-cited references. This figure indicates that overall Y and Ba show a spread at [Fe/H] approximately −1.0. This spread in abundances is compatible with expectations from massive spinstars (see Chiappini et al. 2011; Chiappini 2013), based on predictions by Frischknecht et al. (2016). We note on the other hand that the Sr, Y abundances are derived mostly from Sr I and Y I lines, whereas the dominant species are Sr II and Y II, bringing a non-negligible uncertainty in these values.
The second-peak s-element Ba is low, with a solar ratio, confirming earlier solar-like ratios of Ba-to-Fe and La-to-Fe from Barbuy et al. (2007). Instead, the first-peak elements Y and Sr appear enhanced, from the few lines measurable. This latter result has to be taken with caution, given the noise in the spectra, and the use of neutral species, as mentioned above. If confirmed, this would show once more the difference in nucleosynthesis processes of the first peak elements, that often show enhancements, in a non-identified process, the so-called “lighter element primary process (LEPP)” (mainly Sr, Y, and Zr) process (Travaglio et al. 2004; Bisterzo et al. 2017). The excess of the first-peak heavy-elements could be due to neutrino-driven winds arising in SNII (Woosley et al. 1994), electron-capture supernovae (Wanajo et al. 2011), among other possibilities.
The r-element Eu is enhanced with a mean [Eu/Fe] approximately +0.60, compatible with production by supernovae type II. Presently, the most suitable source of r-elements in SNII is through neutron star mergers, with nucleosynthesis occurring during the merging and milliseconds afterwards (e.g. Wanajo et al. 2014; Goriely et al. 2015). Pian et al. (2017) has confirmed the presence of r-process elements in the neutron star merger GW170817 revealed by LIGO – Laser Interferometer Gravitational-Wave Observatory9 and VIRGO10 experiments.
We notethat high Eu-enhancements in globular clusters are not usual. The case of the Eu-enhanced NGC 5986 (Johnson et al. 2017) might be similar to NGC 6558 in this respect. Enhancements of [Eu/Fe] approximately +0.4 are usually found in field halo and globular cluster stars. As pointed out by Johnson et al. (2017), higher enhancements are instead more typical of dwarf galaxies, such as the so-called r-process ultra-faint dwarf galaxy Reticulum II (Ji et al. 2016), where [Eu/Fe] ≳ +1.7 was derived.The other possible similarity with NGC 5986 is a possible La-enhancement, however it is not clear that this is the case for NGC 6558, and should be further investigated. Moreover, a high La abundance may be incompatible with a low Ba abundance, noting that Ba abundances were not derived in NGC 5986.
The Eu/Ba ratio is indicative of r- to s-process, where a ratio [Eu/Ba] ~ 0.7 points to a nucleosynthetic production through the main r-process (e.g. Trevisan & Barbuy 2014; Battistini & Bensby 2016). In Fig. 11, we show [Eu/Ba] for the same stars as in Fig. 10 for which both Ba and Eu abundances are available. It is interesting to see that three among the four sample stars show ratios compatible with the r-process, and a few other more metal-poor stars are also located in the pure r-process case, whereas most of the stars in the figure are not, their heavy-element abundances being more compatible with a mixture of r- and s-processes.
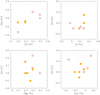 |
Fig. 9 [Na/Fe] vs. [O/Fe], [Al/Fe] vs. [O/Fe], [Al/Fe] vs. [Mg/Fe], and [Al/Fe] vs. [Na/Fe] for the sample stars: indian red open stars, and Barbuy et al. (2007): orange filled squares. |
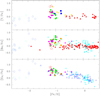 |
Fig. 10 [Y,Ba,Eu/Fe] vs. [Fe/H]. Symbols: present results: red open stars; NGC 6558 (Barbuy et al. 2007): green open stars; NGC 6522 (Barbuy et al. 2014): blue filled squares; HP 1 (Barbuy et al. 2016): green filled pentagons; dwarf microlensedstars (Bensby et al. 2017): red filled triangles; field RGB stars (Siqueira-Mello et al. 2016): gold filled triangles; field RGB stars (van der Swaelmen et al. 2016): cyan filled triangles; field RGB stars (Johnson et al. 2012): blue open triangles; M62 (Yong et al. 2014): magenta filled pentagons; and metal-poor stars: (Howes et al. 2016): royal blue open circles; (Casey & Schlaufman 2015): sky blue open circles; (Koch et al. 2016): acqua-marine open circles. |
8 Conclusions
We present photometric V and I data, and high resolution spectroscopic data for four stars in NGC 6558. With a set of subarcsec (~0.5′′) seeing images obtained at the NTT, with a time difference of 19 yr, proper motion decontamination, with high accuracy, was applied. These photometric data have allowed us to derive reddening and distance, and provided the basis to derive photometric stellar parameters. Based on the proper motions obtained from the combination of these NTT images, by Rossi et al. (2015), the orbital analysis by Pérez-Villegas et al. (2018) has shown that NGC 6558 is trapped by the bar, having an orbit with a radial extension between 0.1 and 2.5 kpc and a maximum vertical excursion of z ~ 1.4 kpc. These orbital parameters are similar to those of the globular cluster HP 1, and approximately two times larger than NGC 6522 (Pérez-Villegas et al. 2018). NGC 6522 and HP 1 have similar ages of 13 Gyr (Kerber et al. 2018a,b), pointing out that these clusters could be among the oldest objects in the Galaxy, trapped at some point in the bar/bulge.
The UVES spectroscopic data allowed to derive the final stellar parameters and abundance ratios for the four sample stars. We note that the abundance pattern of NGC 6558 is very similar to those of NGC 6522 (Barbuy et al. 2014) and HP 1 (Barbuy et al. 2016), in many aspects, as illustrated in Fig. 12. The iron-peak elements in these clusters are also included in the comparison, as derived in Ernandes et al. (2018). The similarities found in the three clusters are: relatively low odd-Z elements Na and Al; normally enhanced α -elements O, Mg; low enhancements of Si, Ca; moderate enhancements of the iron-peak (α -like) Ti; low abundances of the iron-peak elements Mn, Cu, and Zn, where Zn in particular differs from values in bulge field stars (e.g. Barbuy et al. 2015, 2018a,b; da Silveira et al. 2018); relatively high first-peak of heavy elements; variable second-peak heavy elements; variable enhancements of the r-element Eu.
With the present work we are able to gather the analysis of the three main representatives of moderately metal-poor and BHB globular clusters in the bulge, and to compare their shared properties. Further photometric and spectroscopic studies of the oldest globular clusters in the bulge would be of great interest.
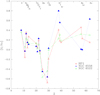 |
Fig. 12 Abundance pattern [X/Fe] vs. atomic number Z of the moderately metal-poor bulge globular clusters NGC 6558, NGC 6522, and HP 1. Symbols: blue filled triangles: NGC 6558; green open triangles: NGC 6522; red open triangles: HP 1. |
Acknowledgements
B.B. and E.B. acknowledge grants from CNPq, CAPES – Finance code 001, and Fapesp. L.M. and H.E. acknowledge CNPq/PIBIC fellowships. L.K. acknowledges a CNPq postdoctoral fellowship and the Fapesp grant 2016/24814-5. A.P.V. acknowledges the Fapesp postdoctoral fellowship no. 2017/15893-1. We thank Elvis Cantelli for data reduction. S.O. acknowledges the Dipartimento di Fisica e Astronomia dell’Università di Padova.
References
- Alonso, A., Arribas, S., & Martínez-Roger, C. 1999, A&AS, 140, 261 [NASA ADS] [CrossRef] [EDP Sciences] [Google Scholar]
- Alonso-García, J., Mateo, M., Sen, B., et al. 2012, AJ, 143, 70 [NASA ADS] [CrossRef] [Google Scholar]
- Ballester, P., Modigliani, A., Boitquin, O., et al. 2000, The Messenger, 101, 31 [NASA ADS] [Google Scholar]
- Barbuy, B., Perrin, M.-N., Katz, D., et al. 2003, A&A, 404, 661 [NASA ADS] [CrossRef] [EDP Sciences] [Google Scholar]
- Barbuy, B., Zoccali, M., Ortolani, S., et al. 2006, A&A, 449, 349 [NASA ADS] [CrossRef] [EDP Sciences] [Google Scholar]
- Barbuy, B., Zoccali, M., Ortolani, S., et al. 2007, AJ, 134, 1613 [NASA ADS] [CrossRef] [Google Scholar]
- Barbuy, B., Zoccali, M., Ortolani, S., et al. 2009, A&A, 507, 405 [NASA ADS] [CrossRef] [EDP Sciences] [Google Scholar]
- Barbuy, B., Chiappini, C., Cantelli, E., et al. 2014, A&A, 570, A76 [NASA ADS] [CrossRef] [EDP Sciences] [Google Scholar]
- Barbuy, B., Friaçsa, A., da Silveira, C.R., et al. 2015, A&A, 580, A40 [NASA ADS] [CrossRef] [EDP Sciences] [Google Scholar]
- Barbuy, B., Cantelli, E., Vemado, A., et al. 2016, A&A, 591, A53 [NASA ADS] [CrossRef] [EDP Sciences] [Google Scholar]
- Barbuy, B., Chiappini, C., Gerhard, O. 2018a, ARA&A, 56, 223 [NASA ADS] [CrossRef] [Google Scholar]
- Barbuy, B., Trevisan, J., de Almeida, A. 2018b, PASA, in press [Google Scholar]
- Battistini, C., & Bensby, T. 2016, A&A, 586, A49 [NASA ADS] [CrossRef] [EDP Sciences] [Google Scholar]
- Bensby, T., Feltzing, S., Gould, A., et al. 2017, A&A, 605, A89 [NASA ADS] [CrossRef] [EDP Sciences] [Google Scholar]
- Bessell, M.S. 1979, PASP, 91, 589 [NASA ADS] [CrossRef] [Google Scholar]
- Bica, E., Bonatto, C., Barbuy, B., & Ortolani, S. 2006, A&A, 450, 105 [NASA ADS] [CrossRef] [EDP Sciences] [Google Scholar]
- Bica, E., Ortolani, S. & Barbuy, B. 2016, PASA, 33, 28 [Google Scholar]
- Bisterzo, S., Travaglio, C., Wiescher, M., Käppeler, F., & Gallino, R. 2017, ApJ, 835, 97 [NASA ADS] [CrossRef] [Google Scholar]
- Blanco, V. 1988, AJ, 95, 1400 [NASA ADS] [CrossRef] [Google Scholar]
- Boley, A. C., Lake, G., Read, J., & Teyssier, R. 2009, ApJ, 706, L192 [NASA ADS] [CrossRef] [Google Scholar]
- Bromm, V., & Yoshida, N. 2011, ARA&A, 49, 373 [NASA ADS] [CrossRef] [Google Scholar]
- Carretta, E., Bragaglia, A., Gratton, R. G., et al. 2009, A&A, 505, 117 [NASA ADS] [CrossRef] [EDP Sciences] [Google Scholar]
- Casey, A.R., & Schlaufman, K. C. 2015, ApJ, 809, 110 [NASA ADS] [CrossRef] [Google Scholar]
- Cayrel, R. 1988, IAU Symp., 132, 345 [Google Scholar]
- Chiappini, C. 2013, Astron. Nachr., 334, 595 [NASA ADS] [CrossRef] [Google Scholar]
- Chiappini, C., Frischknecht, U., Meynet, G., et al. 2011, Nature, 472, 454 (C11) [NASA ADS] [CrossRef] [Google Scholar]
- Chun, S.-H., Kim, J.-W., Shin, I.-G., et al. 2010, A&A, 518, A15 [NASA ADS] [CrossRef] [EDP Sciences] [Google Scholar]
- Coelho, P., Barbuy, B., Meléndez, J., Schiavon, R. P., & Castilho, B. V. 2005, A&A, 443, 735 [NASA ADS] [CrossRef] [EDP Sciences] [Google Scholar]
- da Silveira, C. R., Barbuy, B., Friaça, A., et al. 2018, A&A, 614, A149 [NASA ADS] [CrossRef] [EDP Sciences] [Google Scholar]
- Davidge, T. J., Ledlow, M., & Puxley, P. 2004, AJ, 128, 300 [NASA ADS] [CrossRef] [Google Scholar]
- Davis, S. P., & Phillips, J. G. 1963, The Red System (A2Π-X2Σ) of the CN molecule (MT, USA: Literary Licensing, LLC) [Google Scholar]
- Dean, J. F., Warren, P. R., & Cousins, A. W. J. 1978, MNRAS, 183, 569 [NASA ADS] [CrossRef] [Google Scholar]
- Dekker, H., D’Odorico, S., Kaufer, A., Delabre, B., & Kotzlowski, H. 2000, SPIE, 4008, 534D [Google Scholar]
- Dias, B., Barbuy, B., Saviane, I., et al. 2015, A&A, 573, A13 [NASA ADS] [CrossRef] [EDP Sciences] [Google Scholar]
- Dias, B., Barbuy, B., Saviane, I., et al. 2016, A&A, 590, A9 [NASA ADS] [CrossRef] [EDP Sciences] [Google Scholar]
- Ernandes, H., Barbuy, B., Alves-Brito, A., et al. 2018, A&A, 616, A18 [NASA ADS] [CrossRef] [EDP Sciences] [Google Scholar]
- Friaça, A. C. S., & Barbuy, B. 2017, A&A, 598, A121 [NASA ADS] [CrossRef] [EDP Sciences] [Google Scholar]
- Frischknecth, U., Hirschi, R., Pignatari, M., et al. 2016, MNRAS, 456, 1803 [NASA ADS] [CrossRef] [Google Scholar]
- Gaia Collaboration (Clementini, G., et al.) 2017, A&A, 605, A79 [NASA ADS] [CrossRef] [EDP Sciences] [Google Scholar]
- García-Pérez, A., Cunha, K., Shetrone, M., et al. 2013, ApJ, 767, L9 [NASA ADS] [CrossRef] [Google Scholar]
- Gonzalez Hernandez, J. I., & Bonifacio, P. 2009, A&A, 497, 497 [NASA ADS] [CrossRef] [EDP Sciences] [Google Scholar]
- Goriely, S., Bauswein, A., & Janka, H.-T. 2015, ApJ, 738, L32 [NASA ADS] [CrossRef] [Google Scholar]
- Grevesse, N., & Sauval, J. N. 1998, Space Sci. Rev., 35, 161 [NASA ADS] [CrossRef] [Google Scholar]
- Gustafsson, B., Edvardsson, B., Eriksson, K., et al. 2008, A&A, 486, 951 [NASA ADS] [CrossRef] [EDP Sciences] [Google Scholar]
- Harris, W. E. 1996, AJ 112, 1487 [NASA ADS] [CrossRef] [Google Scholar]
- Hazen, M. L. 1996, AJ 111, 1184 [NASA ADS] [CrossRef] [Google Scholar]
- Hill, V., Lecureur, A., Gómez, A., et al. 2011, A&A, 534, A80 [NASA ADS] [CrossRef] [EDP Sciences] [Google Scholar]
- Hinkle, K., Wallace, L., Valenti, J., & Harmer, D. 2000, Visible and Near Infrared Atlas of the Arcturus Spectrum 3727-9300 Å, eds. K. Hinkle, L. Wallace, J. Valenti, & D. Harmer (San Francisco: ASP) [Google Scholar]
- Howes, L. M., Asplund, M., Keller, S. C., et al. 2016, MNRAS, 460, 884 [NASA ADS] [CrossRef] [Google Scholar]
- Ji, A. P., Frebel, A., Simon, J. D., & Chiti, A. 2016, ApJ, 830, 93 [NASA ADS] [CrossRef] [Google Scholar]
- Johnson, C. I., Rich, R. M., Kobayashi, C., & Fulbright, J. P. 2012, ApJ, 749, 175 [NASA ADS] [CrossRef] [Google Scholar]
- Johnson, C. I., Caldwell, N., Rich, R. M., et al. 2017, ApJ, 842, 24 [NASA ADS] [CrossRef] [Google Scholar]
- Kerber, L. O., Nardiello, D., Ortolani, S., et al. 2018a, ApJ, 853, 15 [NASA ADS] [CrossRef] [Google Scholar]
- Kerber, L. O., Libralato, M., Ortolani, S., et al. 2018b, MNRAS, submitted [Google Scholar]
- Koch, A., McWilliam, A., Preston, G. W., & Thompson, I. B. 2016, A&A, 587, A124 [Google Scholar]
- Kurúcz, R. 1993, CD-ROM 23 [Google Scholar]
- Landolt, A. U. 1983, AJ, 88, 439 [NASA ADS] [CrossRef] [Google Scholar]
- Landolt, A. U. 1992, AJ, 104, 340 [NASA ADS] [CrossRef] [Google Scholar]
- Lecureur, A., Hill, V., Zoccali, M., et al. 2007, A&A, 465, 799 [NASA ADS] [CrossRef] [EDP Sciences] [Google Scholar]
- Martin, W. C., Fuhr, J. R., Kelleher, D.E., et al. 2002, NIST Atomic Database (version 2.0), National Institute of Standards and Technology, http://physics.nist.gov/asd [Google Scholar]
- McWilliam, A. 2016. PASA, 33, 40 [NASA ADS] [CrossRef] [Google Scholar]
- Meléndez, J., & Barbuy, B. 2009, A&A, 497, 611 [NASA ADS] [CrossRef] [EDP Sciences] [Google Scholar]
- Modigliani, A., Mulas, G., Porceddu, I., et al. 2004, The Messenger, 118, 8 [NASA ADS] [Google Scholar]
- Nakasato, N., & Nomoto, K. 2003. ApJ, 588, 842 [NASA ADS] [CrossRef] [Google Scholar]
- Nataf, M. N., Gould, A., Fouqué, P., et al. 2013, ApJ, 769, 88 [NASA ADS] [CrossRef] [Google Scholar]
- Ness, M., Freeman, K., & Athanassoula, E., et al. 2013, MNRAS, 430, 836 [NASA ADS] [CrossRef] [Google Scholar]
- Ness, M., Asplund, M., & Casey, A. R. 2014, MNRAS, 445, 2994 [NASA ADS] [CrossRef] [Google Scholar]
- Ortolani, S., Barbuy, B., Momany, Y., et al. 2011, ApJ, 737, 31 [NASA ADS] [CrossRef] [Google Scholar]
- Pérez-Villegas, A., Rossi, L., Ortolani, S., et al. 2018, PASA, 35, 21 [Google Scholar]
- Phillips, J. G.,& Davis, S. P. 1968, The Swan system of the C2 molecule (California: University of California Press) [Google Scholar]
- Pian, E., D’Avanzo, P., Benetti, S., et al. 2017, Nature, 551, 67 [NASA ADS] [CrossRef] [Google Scholar]
- Pietrinferni, A., Cassisi, S., Salaris, M., & Castelli, F. 2004, ApJ, 612, 167 [NASA ADS] [Google Scholar]
- Piotto, G., Milone, A. P., Bedin, L. R., et al. 2015, AJ, 149, 91 [NASA ADS] [CrossRef] [Google Scholar]
- Piskunov, N., Kupka, F., Ryabchikova, T., Weiss, W., & Jeffery, C. 1995, A&AS, 112, 525 [NASA ADS] [Google Scholar]
- Renzini, A., D’Antona, F., Cassisi, S., et al. 2015, MNRAS, 454, 4197 [NASA ADS] [CrossRef] [Google Scholar]
- Rich, R. M., Ortolani, S., Bica, E., & Barbuy, B. 1998, ApJ, 484, L25 [NASA ADS] [CrossRef] [Google Scholar]
- Rieke, G. H., & Lebofsky, M. J., 1985, ApJ, 288, 618 [NASA ADS] [CrossRef] [Google Scholar]
- Rojas-Arriagada, A., Recio-Blanco, A., Hill, V., et al. 2014, A&A, 569, A103 [NASA ADS] [CrossRef] [EDP Sciences] [Google Scholar]
- Rojas-Arriagada, A., Recio-Blanco, A., de Laverny, P., et al. 2017, A&A, 601, A140 [NASA ADS] [CrossRef] [EDP Sciences] [Google Scholar]
- Rossi, L., Ortolani, S., Bica, E., Barbuy, B., & Bonfanti, A. 2015, MNRAS, 450, 3270 [NASA ADS] [CrossRef] [Google Scholar]
- Saito, R. K., Hempel, M., Minniti, D., et al. 2012, A&A, 537, A107 [NASA ADS] [CrossRef] [EDP Sciences] [Google Scholar]
- Saviane, I., daCosta, G. S., Held, E. V., et al. 2012, A&A, 540, A27 [NASA ADS] [CrossRef] [EDP Sciences] [Google Scholar]
- Schlafly, E. F., & Finkbeiner, D. P. 2011, ApJ, 737, 103 [NASA ADS] [CrossRef] [Google Scholar]
- Schlegel, D. J., Finkbeiner, D. P., & Davis, M. 1998, ApJ, 500, 525 [NASA ADS] [CrossRef] [Google Scholar]
- Siqueira-Mello, C., Chiappini, C., Barbuy, B., et al. 2016, A&A, 593, A79 [NASA ADS] [CrossRef] [EDP Sciences] [Google Scholar]
- Skrutskie, M., Cutri, R. M., Stiening, R., et al. 2006, AJ, 131, 1163 [NASA ADS] [CrossRef] [Google Scholar]
- Soszyński, I., Udalski, A., Szymański, M. K., et al. 2014, Acta Astron., 64, 177 [NASA ADS] [Google Scholar]
- Soto, M., Barbá, R., Gunthardt, G., et al. 2013, A&A, 552, A101 [NASA ADS] [CrossRef] [EDP Sciences] [Google Scholar]
- Stetson, P. B., & Pancino, E. 2008, PASP, 120, 1332 [Google Scholar]
- Terndrup, D. M. 1988, AJ, 96, 884 [NASA ADS] [CrossRef] [Google Scholar]
- Trager, S. C., King, I. R., & Djorgovski, S. 1995, AJ, 109, 218 [NASA ADS] [CrossRef] [Google Scholar]
- Travaglio, C., Gallino, R., Arnone, E., et al. 2004, ApJ, 601, 864 [NASA ADS] [CrossRef] [Google Scholar]
- Trevisan, M., & Barbuy, B. 2014, A&A, 570, A22 [NASA ADS] [CrossRef] [EDP Sciences] [Google Scholar]
- Tumlinson, J. 2010, ApJ, 708, 1398 [NASA ADS] [CrossRef] [Google Scholar]
- Udalski, A., Szymanski, M., Kubiak, M., et al. 2002, Acta Astron., 52, 217 [NASA ADS] [Google Scholar]
- van der Swaelmen, M., Barbuy, B., & Hill, V. 2016, A&A, 586, A1 [NASA ADS] [CrossRef] [EDP Sciences] [Google Scholar]
- Wanajo, S., Janka, H.-T., & Müller, B. 2011, ApJ, 726, L15 [NASA ADS] [CrossRef] [Google Scholar]
- Wanajo, S., Sekiguchi, Y., Nishimura, N., et al. 2014, ApJ, 789, L39 [NASA ADS] [CrossRef] [Google Scholar]
- Wise, J. H., Turk, M. J., Norman, M. L., & Abel, T. 2012, ApJ, 745, 50 [NASA ADS] [CrossRef] [Google Scholar]
- Woosley, S. E., & Weaver, T. A. 1995, ApJS, 101, 181 [NASA ADS] [CrossRef] [Google Scholar]
- Woosley, S. E., Wilson, J. R., Mathews, G. J., Hoffman, R. D., & Meyer, B. S. 1994, ApJ, 433, 229 [NASA ADS] [CrossRef] [Google Scholar]
- Woosley, S., Heger, A., & Weaver, T. A. 2002, Rev. Mod. Phys., 74, 1015 [NASA ADS] [CrossRef] [Google Scholar]
- Yong, D., Alves-Brito, A., Da Costa, G., et al. 2014, MNRAS, 439, 2638 [NASA ADS] [CrossRef] [Google Scholar]
- Zoccali, M., Lecureur, A., Hill, V., et al. 2008, A&A, 486, 177 [NASA ADS] [CrossRef] [EDP Sciences] [Google Scholar]
- Zoccali, M., Vasquez, S., Gonzalez, O.A., et al. 2017, A&A, 599, A12 [NASA ADS] [CrossRef] [EDP Sciences] [Google Scholar]
All Tables
Radial velocities of the UVES sample stars, in each of the six exposure runs, corresponding heliocentric radial velocities and mean heliocentric radial velocity.
Photometric stellar parameters derived using the calibrations by Alonso et al. (1999) for V – I, V – K, J– K, bolometric corrections, bolometric magnitudes and corresponding gravity log g, and final spectroscopic parameters.
Mean abundances of odd-Z elements Na, Al, α-elements O, Mg, Si, Ca, Ti, and the heavy elements Eu, Ba, Y, Sr.
Abundance uncertainties for star N6558:283, for uncertainties of ΔTeff = 100 K, Δlog g = 0.2, Δ vt = 0.2 km s−1 and corresponding total error.
All Figures
|
Fig. 1 VVV image of NGC 6558 in combined JY Z colours, in size of 3.6′× 2.4′. The four sample stars are identified as red filled circles, and RR Lyrae from OGLE are identified by cyan filled circles. |
| In the text | |
|
Fig. 2 V vs. V – I colour–magnitude diagram of NGC 6558 from NTT 2012 data. The four sample stars are shown as red stars, and RR Lyrae are shown as green filled circles. A BaSTI isochrone for an age of 13 Gyr, [Fe/H] = −1.0 and primordial helium abundance (Y = 0.25) is overplotted. |
| In the text | |
|
Fig. 3 SiI 5948.545, CaI 6493.788, and CaI 6572.779 Å lines in the four sample stars. Calculations for different [Si/Fe] and [Ca/Fe] are shown, with values as indicated in each panel. |
| In the text | |
|
Fig. 4 TiI 5866.449 and 6126.214 Å lines in the four sample stars. Calculations for different [Ti/Fe] are shown, with values as indicated in each panel. |
| In the text | |
|
Fig. 5 EuII 6645.064 and BaII 6496.897 Å lines in the four sample stars. Calculations for different [Eu/Fe] and [Ba/Fe] are shown, with values as indicated in each panel. |
| In the text | |
|
Fig. 6 EuII 6347.640 Å in star 283. |
| In the text | |
|
Fig. 7 YI 6435.004 and YII 6795.414 Å lines in stars 283, 364 and 1072. Calculations for different [Y/Fe] are shown, with values as indicated in each panel. |
| In the text | |
|
Fig. 8 SrI 6550.244 Å line in star 364. Calculations for different values of [Sr/Fe] as indicated in the panel are shown. |
| In the text | |
|
Fig. 9 [Na/Fe] vs. [O/Fe], [Al/Fe] vs. [O/Fe], [Al/Fe] vs. [Mg/Fe], and [Al/Fe] vs. [Na/Fe] for the sample stars: indian red open stars, and Barbuy et al. (2007): orange filled squares. |
| In the text | |
|
Fig. 10 [Y,Ba,Eu/Fe] vs. [Fe/H]. Symbols: present results: red open stars; NGC 6558 (Barbuy et al. 2007): green open stars; NGC 6522 (Barbuy et al. 2014): blue filled squares; HP 1 (Barbuy et al. 2016): green filled pentagons; dwarf microlensedstars (Bensby et al. 2017): red filled triangles; field RGB stars (Siqueira-Mello et al. 2016): gold filled triangles; field RGB stars (van der Swaelmen et al. 2016): cyan filled triangles; field RGB stars (Johnson et al. 2012): blue open triangles; M62 (Yong et al. 2014): magenta filled pentagons; and metal-poor stars: (Howes et al. 2016): royal blue open circles; (Casey & Schlaufman 2015): sky blue open circles; (Koch et al. 2016): acqua-marine open circles. |
| In the text | |
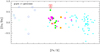 |
Fig. 11 [Eu/Ba] vs. [Fe/H]. Same symbols as in Fig. 10. |
| In the text | |
|
Fig. 12 Abundance pattern [X/Fe] vs. atomic number Z of the moderately metal-poor bulge globular clusters NGC 6558, NGC 6522, and HP 1. Symbols: blue filled triangles: NGC 6558; green open triangles: NGC 6522; red open triangles: HP 1. |
| In the text | |
Current usage metrics show cumulative count of Article Views (full-text article views including HTML views, PDF and ePub downloads, according to the available data) and Abstracts Views on Vision4Press platform.
Data correspond to usage on the plateform after 2015. The current usage metrics is available 48-96 hours after online publication and is updated daily on week days.
Initial download of the metrics may take a while.