Fig. 11.
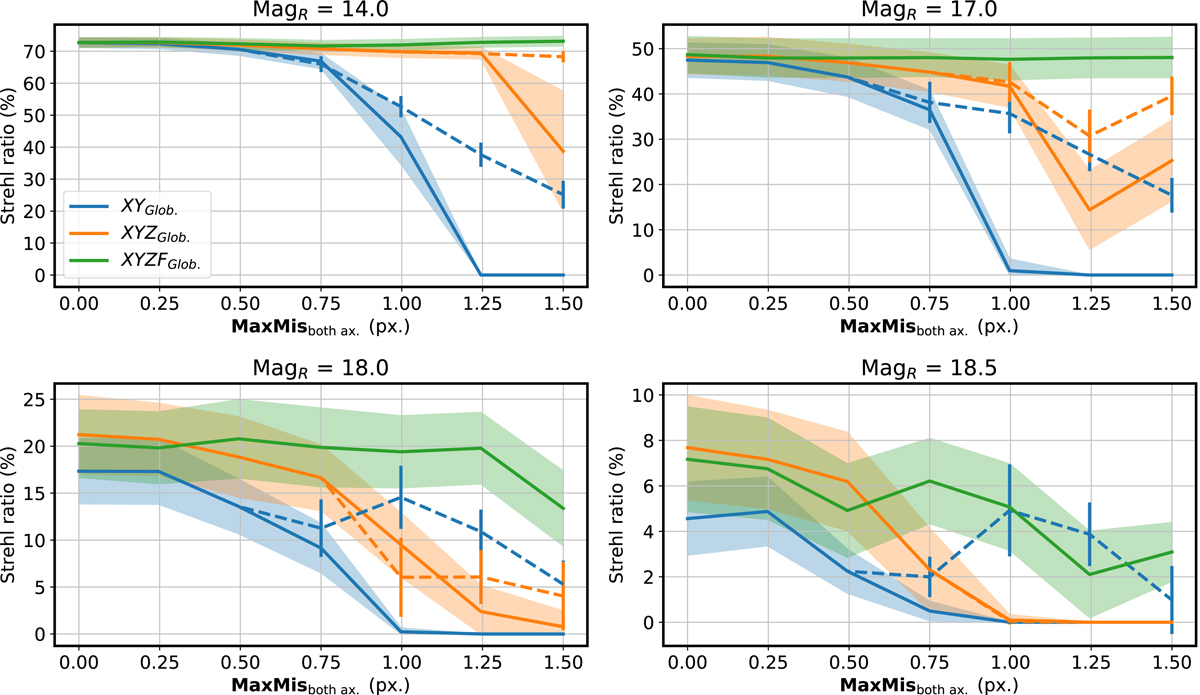
Numerical simulation performance results for various misalignment scenarios. Solid lines: all DM modes controlled (error as shaded areas, defined as in Fig. 10); dashed lines: modes with dominant energy in Z and F filtered (error as solid bars), only shown when relative difference to unfiltered control is larger than 1%. The Strehl ratio (S.R.) is measured at 1650 nm. Results are shown for rMod = 2 λ/D; simulations for 4 λ/D and 6 λ/D achieve similar performance.
Current usage metrics show cumulative count of Article Views (full-text article views including HTML views, PDF and ePub downloads, according to the available data) and Abstracts Views on Vision4Press platform.
Data correspond to usage on the plateform after 2015. The current usage metrics is available 48-96 hours after online publication and is updated daily on week days.
Initial download of the metrics may take a while.